What's New Archive
![]() The U.S. government is closed. This site will not be updated; however, NOAA websites and social media channels necessary to protect lives and property will be maintained. To learn more, visit commerce.gov.
The U.S. government is closed. This site will not be updated; however, NOAA websites and social media channels necessary to protect lives and property will be maintained. To learn more, visit commerce.gov.
For the latest forecasts and critical weather information, visit weather.gov.
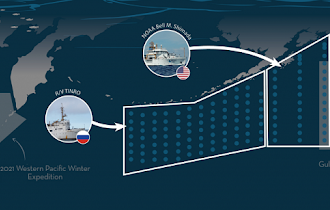
Zone map for the 2022 Pan-Pacific Winter High Seas Expedition(click on image to see the full map).Credit: NOAA Fisheries
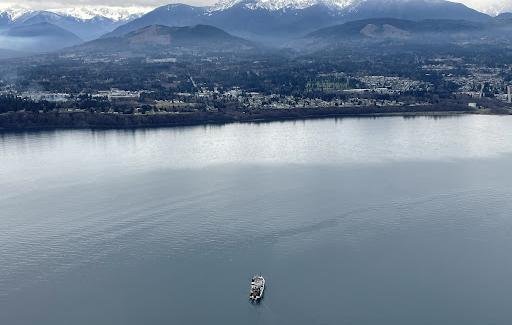
NOAA Ship Shimada leaving Port Angeles, Washington to join the Year of the Salmon Expedition. Photo Credit: CDR Duncan/NOAA
February 1 - March 7: NOAA PMEL scientists join NOAA Fisheries and an international team of researchers aboard the NOAA R/V Shimada to provide expertise in physical oceanography and lead hydrographic data collection, nutrient sampling, analysis and processing. EcoFOCI is taking part in the International Year of the Salmon expedition to help detect and monitor changes both within Pacific salmon and their respective ecosystems, especially in the Gulf of Alaska.
Pacific salmon are a uniquely important resource for countries across the North Pacific yet there are major scientific gaps in our understanding of the ocean phase of the salmon life cycle. This cruise will collect vital data to improve that understanding and aid in forecasting and management of salmon.
The expedition will include as many as five research vessels to conduct the largest ever pan-Pacific, epipelagic ecosystem survey during winter, focused on understanding salmon and their ecosystems. The 2022 Expedition will involve a full ecosystem survey with pelagic trawling and detailed sampling of marine life in the upper ocean and will include research on physical, biological and chemical oceanography. Novel technologies such as gliders, environmental DNA and genetic stock identification will be used to enhance research efforts. This collaborative international effort spanning the entire North Pacific includes scientists from Canada, Japan, the Republic of Korea, the Russian Federation, and the United States.
The data collected by PMEL will provide key baseline and comparative data to the overall pan-Pacific collaboration focused on salmon recovery. During the expedition, PMEL will collect samples from over 30 CTD stations, deploy satellite-tracked drifters and several Argo floats, and collect carbon dioxide, nutrient and salinity measurements from an on-board flow-through system.
The research cruise will extend from 1 February to 7 March in the central to western Gulf of Alaska. More about the expedition: https://yearofthesalmon.org/2022expedition/
Follow along with the expedition on the blog and more details online: https://www.fisheries.noaa.gov/west-coast/2022-pan-pacific-winter-high-seas-expedition
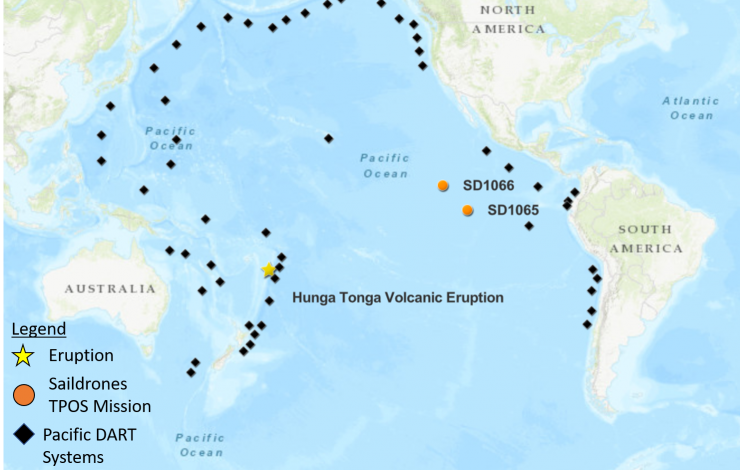
Map of the tropical Pacific showing the positions of DART buoys operated by NOAA and international partners as well as saildrone 1065 and 1066 relative to the Hunga Ha’apai Volcano located in the Pacific island nation of Tonga, which is an archipelago consisting of more than 170 islands.
On January 15, 2022, the Hunga Tonga-Hunga Ha’apai volcano erupted off the coast of Tonga in the South Pacific Ocean, generating a tsunami and triggering tsunami alerts around the world. Most tsunamis are commonly caused by earthquakes and only about 5% of tsunamis are generated from volcanic activity (ITIC), making this a rare event captured by NOAA’s observing instruments.
Buoys and Saildrone uncrewed surface vehicles additionally recorded an air pressure wave associated from the eruption. The pressure wave from the volcano explosion was detected as far as the Mediterranean Sea and traveled about 312 meters/second (697 miles per hour) and circled the Earth three times before dissipating. The Krakatau eruption in 1883 was the last event of such scale. Krakatau produced similar air pressure waves and a devastating tsunami that claimed the lives of ~36,000 people and the destruction of hundreds of coastal towns and villages.
Deep-ocean Assessment and Reporting of Tsunamis (DART) systems are strategically deployed by NOAA and international partners around the Pacific Ocean to detect tsunami waves and send data in realtime to tsunami warning centers. These systems recorded the propagating tsunami across the Pacific and prompted expansion of the tsunami alerts for many coastlines in the Pacific. Those warnings may have saved lives at many coastlines that were later flooded by the waves, some as far as the Pacific coast of Peru.
Along with the tsunami wave amplitudes measured by the DART system, the atmospheric pressure wave associated with a shock-wave emanating from the volcano explosion was measured. The air pressure signal detected by weather station buoys is the leading signature before the tsunami wave train and may provide clues for the mechanism of this unusual tsunami generation. However, given that the pressure signal mixed with the tsunami amplitudes in the data, high-resolution air pressure measurements are needed to decipher the DART tsunami records.
Coincidentally, two NOAA-Saildrone drones were approximately 3500 nautical miles (~4028 miles) away from the eruption, the distance to drive between Anchorage, Alaska and Miami, Florida, in the eastern tropical Pacific Ocean. The two drones are part of a 6-month, ongoing Tropical Pacific Observing System (TPOS) mission targeting the eastern tropical Pacific hurricane genesis region and El Niño Southern Oscillation (ENSO) development. The two drones were able to detect an atmospheric pressure jump in high-resolution measurements, capturing crucial information associated with the remote volcanic activity in an observationally-sparse region of the ocean for post-analysis with the DART tsunami records.
The phenomena recorded in the data is unique and additional research and development is needed to accommodate these types of tsunami events in the model used to forecast tsunami events. PMEL tsunami researchers are analyzing the data from the various platforms to get a better understanding of this rare event.
PMEL has also previously studied the dynamics of a smaller scale eruptive activity of this volcano using acoustic data and will uncover and analyze additional acoustic data from hydrophones deployed across the Pacific when they are recovered later this year.
Read more on the TPOS 2021 Saildrone Mission on the blog page.
More about the event can be found on the PMEL Tsunami Research group events page.
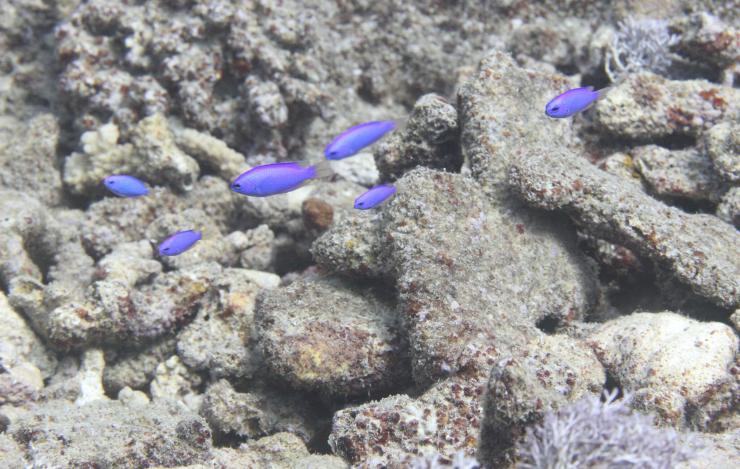
Damselfish in a tropical reef region within the National Park of American Samoa. Photo Credit National Park System. Click here to listen to a recording of damselfish.
A research team led by NOAA’s Cooperative Institute for Marine Ecosystem and Resource Studies at Oregon State University has developed an automated method that can accurately identify calls from a family of fishes.
The method takes advantage of data collected by underwater microphones known as hydrophones and provides an efficient and inexpensive way to understand changes in the marine environment due to climate change and other human-caused influences, said researchers from Oregon State’s Cooperative Institute for Marine Ecosystem and Resource Studies.
The findings were published in the journal Marine Ecology Progress Series.
Hydrophones are increasingly being deployed in the world’s oceans. They offer advantages over other types of monitoring because they work at night, in low-visibility conditions and over long periods of time. But techniques to efficiently analyze data from hydrophones are not well developed.
This new research led by Jill Munger when she was an undergraduate student, begins to change that. Munger came to Oregon State having worked more than 20 years in the corporate world. An avid scuba diver, she wanted to study the ocean. She received a fellowship from CIMERS to research underwater acoustics with Joe Haxel, who at the time was at the Hatfield Marine Science Center in Newport working with National Oceanic and Atmospheric Administration’s Pacific Marine Environmental Lab’s acoustic program.
Haxel handed her a hard drive with 18,000 hours of acoustic data collected over 39 months in a tropical reef region within the National Park of American Samoa. American Samoa is a U.S. territory in the western Pacific Ocean.
The data was collected via a 12-station hydrophone array maintained by NOAA and the National Park Service that is distributed throughout the world in water controlled by the United States. The hydrophones were designed and built by NOAA and CIMERS researchers at Hatfield Marine Science Center.
Munger decided to focus on calls from damselfish, in part, because they are distinctive. They grind their teeth to create pops, clicks and chirps associated with aggressive behavior and nest defense. She compared the sound to purring kittens. Quickly, it became apparent to her that manually listening to the recordings was not going to work.
“This is such a slow and tedious process,” she remembered thinking. “I have all this data, and I am just looking at a tiny, tiny portion of it. What’s happening in all the other parts that I haven’t had a chance to listen to?”
A conversation with her brother, Daniel Herrera, a machine learning engineer, sparked an idea. Could they use machine learning to automate the analysis of the data?
Machine learning algorithms build a model based on sample data, known as training data, to make predictions or decisions without being explicitly programmed to do so.
Machine learning techniques have been used to automate processing of large amounts of data from passive acoustic monitoring devices that collected sound data from birds, bats and marine mammals. The techniques have been used for fish calls, but it is an underdeveloped area of science, Munger said.
In this case, the machine learning sample or training data was 400 to 500 damselfish calls Munger identified by manually listening to the hydrophone recordings. With that start, Herrera, a co-author of the paper, built a machine learning model that accurately identified 94% of damselfish calls.
“We built a machine learning model on a relatively small set of training data and then applied it to an enormous set of data,” Munger said. “The implications for monitoring the environment are huge.”
Munger, who now works in the lab of Scott Heppell, an associate professor in Oregon State’s Department of Fisheries, Wildlife, and Conservation Sciences in the College of Agricultural Sciences, believes machine learning will increasingly be used by scientists to monitor many species of fish in the ocean because it requires relatively little effort.
“The benefit to observing fish calls over a long period of time is that we can start to understand how it’s related to changing ocean conditions, which influence our nation’s living marine resources,” Munger said. “For example, damselfish call abundance can be an indicator of coral reef health.”
Munger received input from National Park Service staff on the biology of the damselfish and the reef habitats in close proximity to the hydrophone.
Other co-authors of the paper are Haxel, Heppell, and Samara Haver, all of Oregon State; Lynn Waterhouse, formerly of John G. Shedd Aquarium in Chicago; Megan McKenna, formerly of Natural Sounds and Night Skies Division, National Park Service, Fort Collins, Colorado; and Jason Gedamke and Robert Dziak of NOAA’s Office of Science and Technology, Silver Spring, Maryland, and Pacific Marine Environmental Laboratory, Newport, respectively.
The following article was written by Sean Nealon at Oregon State University and adapted for NOAA PMEL. The Oregon State University news release is available online.
NOAA’s 2021 Arctic Report Card, released today at the American Geophysical Union’s Fall Meeting, documents the numerous ways that climate change continues to fundamentally alter this once reliably-frozen region, as increasing heat and the loss of ice drive its transformation into a warmer, less frozen, and more uncertain future.
The Arctic continues to warm more than twice as fast as the rest of the globe. The October-December 2020 period was the warmest Arctic autumn on record dating back to 1900. The average surface air temperature over the Arctic this past year (October 2020-September 2021) was the 7th warmest on record.
The total extent of sea ice in September 2021 was the 12th lowest on record. All 15 of the lowest minimum extents have occurred in the last 15 years. The substantial decline in Arctic ice extent since 1979 is one of the most iconic indicators of climate change.
Some of the fastest rates of ocean acidification around the world have been observed in the Arctic Ocean. Two recent studies indicate a high occurrence of severe dissolution of shells in natural populations of sea snails, an important forage species, in the Bering Sea and Amundsen Gulf.
The Arctic Report Card is an original, peer-reviewed environmental observations and analysis that documents rapid and dramatic shifts in weather, climate, terrestrial and oceanic conditions in the circumpolar region. This year’s report was compiled by 111 scientists from 12 nations. PMEL and UW Cooperative Institute scientists contributed to sections on surface air temperature (Dr. James Overland, Dr. Muyin Wang), sea ice (Dr. Kevin Wood) and on ocean acidification (Dr. Jessica Cross, Dr. Darren Pilcher).
Check out the visual highlights and more details of the full Arctic Report Card.
Read the original NOAA Press Release and the recorded AGU Press Conference.
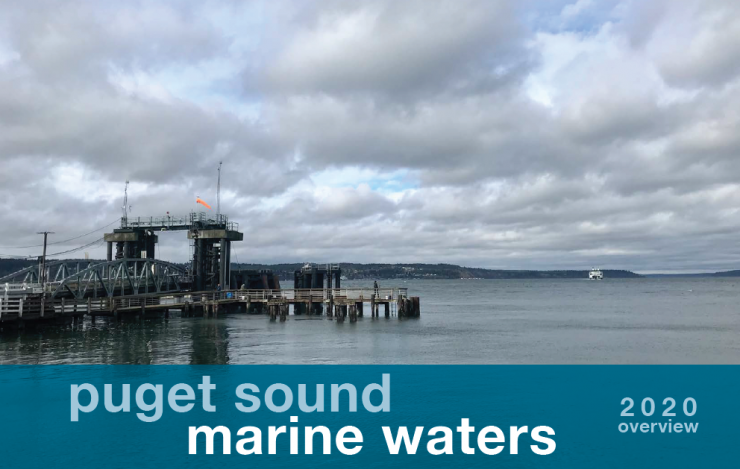
New Puget Sound Marine Waters 2020 Report Released: Automated buoys and volunteers helped gather critical Puget Sound data during pandemic. Photo Credit: Puget Sound Partnership 2021
New Report Released: Automated buoys and volunteers helped gather critical Puget Sound data during pandemic
On October 27, the Puget Sound Marine Waters Work Group of the Puget Sound Ecosystem Monitoring Program released the tenth annual report on marine water conditions in Puget Sound providing a comprehensive long-term view and current assessment of the Puget Sound marine ecosystem. There were few extreme weather or ecological events in 2020, but overall, conditions in Puget Sound were generally warmer, sunnier, and wetter than in typical years. The report further reveals patterns and trends in numerous environmental parameters, including plankton, water quality, climate, and marine life. The observations in this report collectively provide both a comprehensive long-term view and current assessment of the Puget Sound marine ecosystem.
In Puget Sound, ocean acidification (OA) continues as does our understanding of patterns. Annual average atmospheric carbon dioxide (CO2) values over Hood Canal were high relative to globally averaged marine surface air, yet were at the same level as in 2019. OA in Puget Sound is of particular concern as estuarine processes, both natural and human-mediated, can also increase the CO2 content and lower the pH of marine waters. Moreover, coastal upwelling brings deeper waters with naturally higher CO2 concentrations upwards and into Puget Sound via the Strait of Juan de Fuca. Thus, Puget Sound is influenced by a variety of drivers that exacerbate the growing OA signal, making our waters particularly sensitive to these conditions. All of these changes have ramifications for marine food webs and are areas of active current research, including PMEL's Moored Autonomous pCO2 (MAPCO2TM) system collecting on atmospheric and surface seawater xCO2 (mole fraction of CO2) at the Ćháʔba· mooring off of La Push, WA and at the Cape Elizabeth mooring.
Having high-quality observations of carbon in the coastal environment is important for understanding coastal ocean carbon and its impact throughout the water column and the ecosystem. Learn more about PMEL's Carbon and Ocean Acidification Research.
Read the full report here.
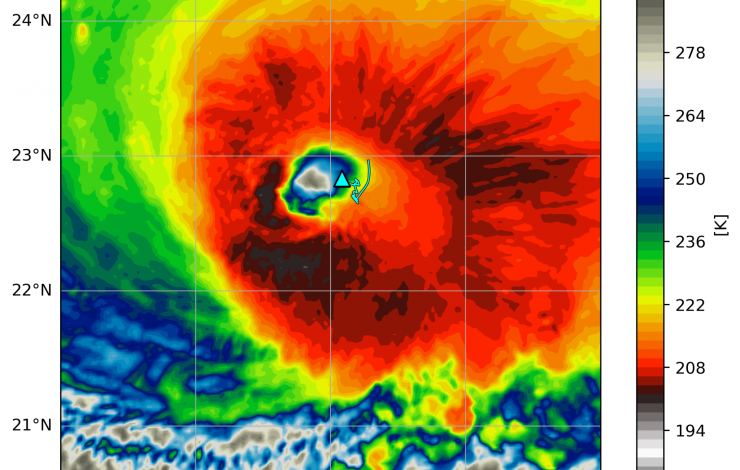
Saildrone 1045 location (triangle) overlaid on an infrared image from NOAA geostationary satellite (colors) at 16:00 UTC September 30, 2021. The saildrone track (light blue line) starts at 04:00 UTC on the same day. Courtesy of Edorado Mazza/University of Washington.
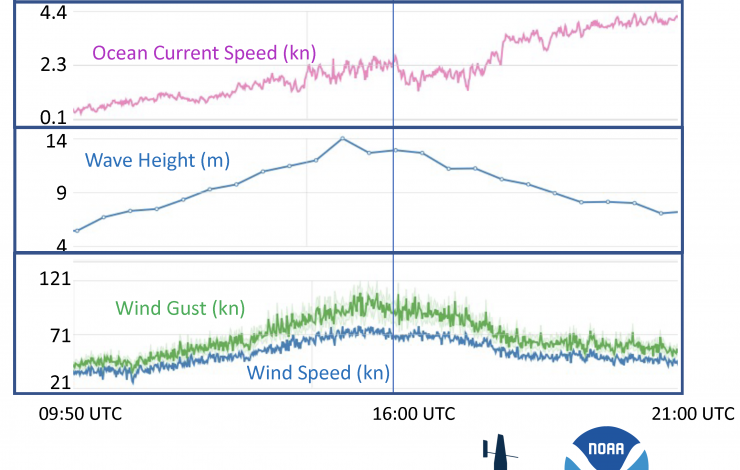
Time series of saildrone measurements of wind, humidity, pressure, current speed, wave heights and solar radiation on September 30, 2021. Vertical line marks the time when the saildrone was located inside the eyewall of Hurricane Sam. Click on image to view all the variables.
Saildrone 1045, one of the five drones PMEL and AOML deployed in the western Atlantic was steered into position to intercept Category 4 Hurricane Sam on September 30, 2021 to record critical data. The encounter required precise interpretation of hurricane forecasts and tight collaboration with Saildrone pilots. The saildrone measured one-minute sustained wind speeds of up to 90.6 miles per hour (40.5 m/s) with wind gusts up to 126.5 mph (56.5 meters/second), waves exceeding 46.4 feet (14.2 meters), and saturated air near the surface. The saildrone was in the hurricane eye next to the eyewall at 16:00 UTC / 12:00 EDT and was in sustained hurricane-force winds (at least 75 mph) for about two hours straight. The first ever drone camera images and video show a large amount of sea spray from the ocean surface and are a frightening display of the power of tropical cyclones.
This is the first time that sea surface conditions near a hurricane eye were observed by an uncrewed surface vehicle. Its success is built upon years of partnership between NOAA and Saildrone, Inc. with testing in progressively more hostile environments and 5 years of innovative engineering on the platform, sensors, and data processing, months of preparation leading to the deployment, and dedicated efforts of operating saildrones by the NOAA science team and Saildrone pilots during the deployment. This animation shows how the saildrone intercepted Hurricane Sam, and this animation, created by scientists at NOAA AOML, shows how the saildrone was positioned to intercept Hurricane Sam alongside saildrone observations of Hurricane Sam.
Prior to hurricane Sam, the NOAA saildrones also measured tropical storms Peter (9/21/2021), Henri (8/20/2021), Grace (8/17/2021) and Fred (8/13/2021). Read more about these encounters on the mission blog: https://www.pmel.noaa.gov/saildrone-hurricane2021/mission_blog.html
Read more on NOAA.gov: A world first: Ocean drone captures video from inside a hurricane
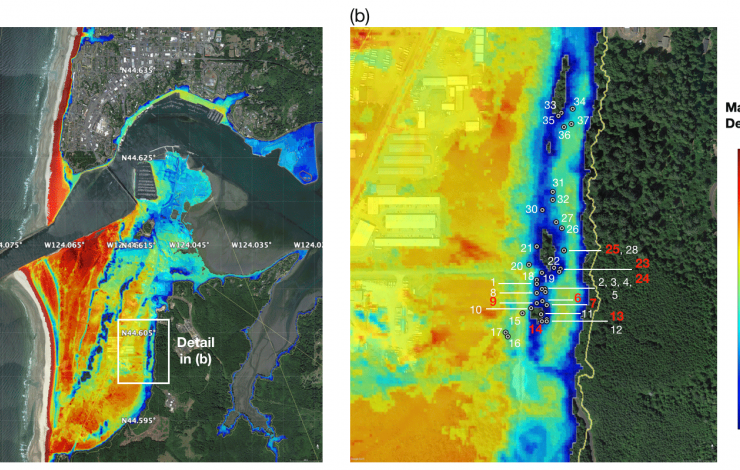
The left panel shows the model of maximum tsunami inundation depth at South Beach for the 1700 CE event and on the right a zoomed-in view of the tsunami inundation depth at Mike Miller State Park. Gray dotted circles show location of trees used in this study on the north side of the stand. Colors on the map show inundation depth from the model, implying 0–10 m of inundation depth at the Mike Miller Park Douglas-fir stand. Green areas are high ground locations that show no inundation. Dziak et al. 2021
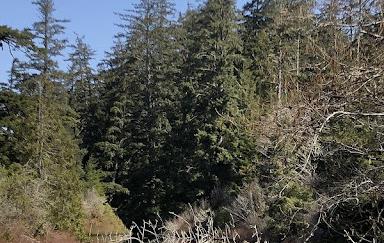
A stand of old growth Douglas-firs near a pond in Mike Miller Park in South Beach, Oregon
Core samples taken from a stand of old growth Douglas-fir trees in the South Beach area just south of Newport showed reduced growth following the 9.0 earthquake and subsequent tsunami that struck the Pacific Northwest in 1700.
The physical evidence from the Douglas-fir tree rings confirms modeling that depicts the reach of the January 1700 quake, which was the last major earthquake to hit the Cascadia Subduction Zone, said Robert Dziak, NOAA PMEL Acoustic Program lead.
“The tsunami appears to be the event that most affected the trees’ growth that year,” said Dziak, whose work includes ocean acoustic studies, signal analysis and tsunami modeling. He also holds a courtesy appointment in Oregon State University’s College of Earth, Ocean, and Atmospheric Sciences. “Getting these little bits of the picture helps us understand what we might expect when the next ‘big one’ hits.”
The findings were published recently in the journal Natural Hazards and Earth System Sciences.
The idea for the study dates back more than a decade; Dziak was aware of past research that had shown evidence of the 1700 quake in trees in Washington, and thought it might be worth seeing if similar evidence existed in Oregon.
The first challenge was finding a stand of old growth Douglas-firs in the tsunami inundation zone. The researchers looked at a few places before locating the stand in Mike Miller Park in South Beach, about two kilometers south of Yaquina Bay and 1.2 kilometers east of the present-day ocean shoreline.
“We’re not sure why this tree stand wasn’t logged over the years, but we’re very fortunate to have a site so close to the coastline that has survived,” said coauthor Bryan Black of the Laboratory of Tree-Ring Research at the University of Arizona, Tucson.
A new and updated tsunami model run by the researchers as part of the study shows that the area could have been inundated by up to 10 meters of water in the 1700 tsunami event, said Dziak.
Once the old growth stand was identified, the researchers collected core samples from about 38 trees using a process that allows them to analyze the tree rings without damaging the overall health of the trees. The majority of the trees dated to around 1670, with one dating to 1650, Dziak said.
They analyzed the growth rates in the rings and compared the growth rates to those of other old-growth Douglas-firs at sites not in the tsunami inundation zone. They found that in 1700 the trees in the tsunami inundation zone showed a significantly reduced growth rate.
Researchers are still working to figure out why the tsunami might have affected the trees’ growth since the trees are relatively far from the shoreline. They suspect it may be a combination of the ground shaking from the earthquake and the inundation of seawater.
“The salty seawater from a tsunami typically drains pretty quickly, but there is a pond area in Mike Miller Park where the seawater likely settled and remained for a longer period of time,” Dziak said.
Black added that the researchers’ next step is to conduct an isotopic analysis on the wood from 1700.
“We will look for signatures consistent with those found in trees that were inundated by the 2011 Tohoku tsunami in Japan,” he said. “If successful, we could develop a powerful new technique to map prehistoric tsunami run-up along the Pacific Northwest coast.”
Yong Wei of the University of Washington Cooperative Institute for Climate, Ocean and Ecosystem Studies and Susan Merle of the Cooperative Institute for Marine Resource Studies at Oregon State University’s Hatfield Marine Science Center are co-authors.
Originally posted on OSU News on August 24, 2021
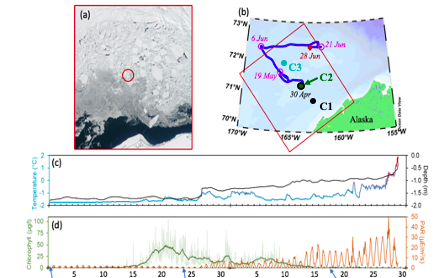
During the first Chukchi deployment, floats resurfaced under a sheet of floating ice (ice floe), monitored and tracked the ice region for almost two months and detected an under-ice algae bloom (Stabeno et. al, 2020). The bottom row shows the captured images with no bloom and/or algae.
After spending 8 months under water and ice, two of NOAA’s three Arctic-deployed pop-up floats have successfully surfaced in the Chukchi Sea and are transmitting data on temperature, pressure, photosynthetic active radiation (PAR), and chlorophyll fluorescence. These data are from measurements taken while the float is anchored to the seafloor, while it rises through the water column, and while it is trapped under the ice at the water-ice boundary.
The two floats were initially deployed in the fall of 2020 by the scientists and crew of NOAA Ship Oscar Dyson. These are part of the 4th cohort of deployments since 2017, and the second cohort deployed in the Chukchi Sea. The first float to surface has transmitted data from the four months it spent on the seafloor, just over a month of data from when it was trapped under ice, and about half of the photos it took while under ice. The second float has transmitted about five months of data from the seafloor, just over four months of data from under the ice along with the under-ice photos it captured, and 7 days of open ocean sea surface temperature.
Pop-up floats provide an inexpensive method to explore a unique micro-ecosystem under floating ice. The floats collect ocean health data to help researchers better understand the rapidly changing Arctic ecosystem. They collect data during the ice-covered winter and spring months, a time during which it isn’t possible for researchers to penetrate the ice from above to study the water underneath. The water column data they collect on their rise up from seafloor to surface is essential for researchers to monitor ongoing ecosystem changes in the Arctic, such as watching for harmful algal blooms and documenting biodiversity in the environment. The floats can also help researchers measure the extent of the cold pool, an area of cold water about 30 meters deep that results from melting Arctic ice from the previous season.
NOAA PMEL began development of these floats in 2015. The float is an orange sphere equipped with sensors to measure temperature, pressure, and other ocean conditions as well as cameras to capture under ice imagery. It is deployed during the ice-free summer months and anchors to the seafloor measuring bottom-ocean conditions. It stays here collecting measurements throughout the winter and early spring. It then rises up through the water column at a pre-programmed time, in this case early March to mid-April, capturing data at various depths to create a profile of the water column. The floats are then trapped under ice when it reaches the surface, and will continue collecting data and images of conditions at the water-ice boundary. When the ice melts in mid-May and early June, the floats can emerge fully from the ice to reach the surface and begin transmitting their stored data, while continuing to monitor sea surface temperature.
Read more about the 2020 pop-up deployments in Arctic Today and on the ITAE website.

Craig McLean and G. A. Ramadass hold up their signed partnership agreement pages during the virtual ceremony on August 9, 2021.
On August 9, 2021, representatives from NOAA and the Ministry of Earth Sciences (MoES) of India signed an updated partnership agreement that marks more than 12 years of partnership between these nations in the name of ocean and atmospheric observations for improved weather and climate prediction. The virtual signing ceremony included a live demonstration of a new joint oceanographic data portal that makes data from the RAMA-OMNI moored buoy array in the Indian Ocean publicly available for the benefit of global science, forecasting, and disaster preparedness.
“The Indian Ocean is where the monsoon patterns arise that will impact the agriculture and the economic activity of India. But it’s the same basin as well where weather begins that affects North America,” said Craig McLean, NOAA Assistant Administrator for Oceanic and Atmospheric Research. “Our weather in the Americas, the farmlands and what we declare as the production belt of wheat and other crops in the United States - our Midwest - it’s told in advance by understanding what is happening in the Indian Ocean.”
The Research Moored Array for African-Asian-Australian Monsoon Analysis and Prediction (RAMA) was designed to study the Indian Ocean’s role in monsoons, improve monsoon forecasts, and to better study the historically data-sparse Indian Ocean. The first RAMA buoys were deployed by NOAA PMEL in 2004, with the most recent moorings deployed in the Arabian Sea in 2019. MoES has extended operational support to the RAMA array since the earliest deployments. RAMA buoys collect data on a range of atmospheric and oceanic variables, including ocean temperature, salinity, currents, wind, sea level air pressure and humidity. Data collected within RAMA has been extensively used globally and in collaborations between NOAA and MoES scientists to understand the thermohaline structure in the Bay of Bengal, and to validate satellite products and ocean-climate-weather models.
The Ocean Moored Buoys in the Northern Indian Ocean (OMNI) array was initially deployed in 2012, and MoES announced in 2018 that data from the open ocean elements of the OMNI array would be open access and shared freely among researchers to help improve the accuracy of forecasts.
The renewed partnership and joint data portal will significantly benefit the U.S., Indian, and global community working in ocean and climate science, forecasting, and disaster preparedness, especially as we enter the UN Decade of Ocean Science for Sustainable Development and look for new ways to address the climate crisis.
Story modified from NOAA’s Global Ocean Monitoring and Observing Program.
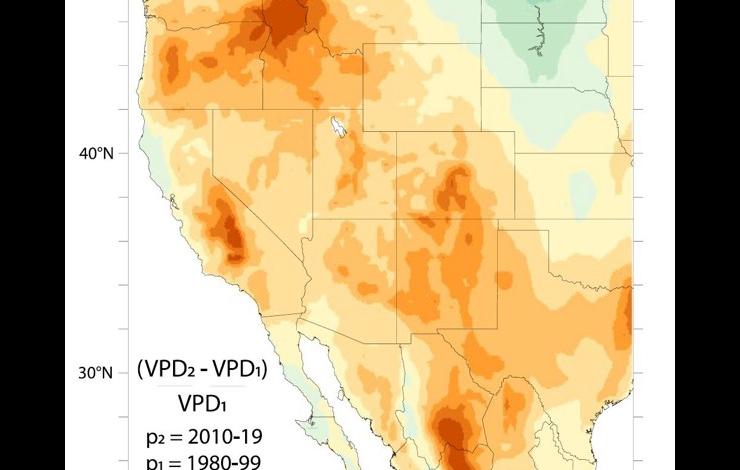
The research study calculated the percent change from the ’80s and ’90s to the 2010s in the nighttime vapor pressure deficit, a measure of the drying power of the air, during summer months. Nighttime conditions were much more conducive to drying in recent years, especially in California’s central valley and the Bitterroot-Blue Mountain region of Idaho and surrounding states. Chiodi et al. 2021/Geophysical Research Letters
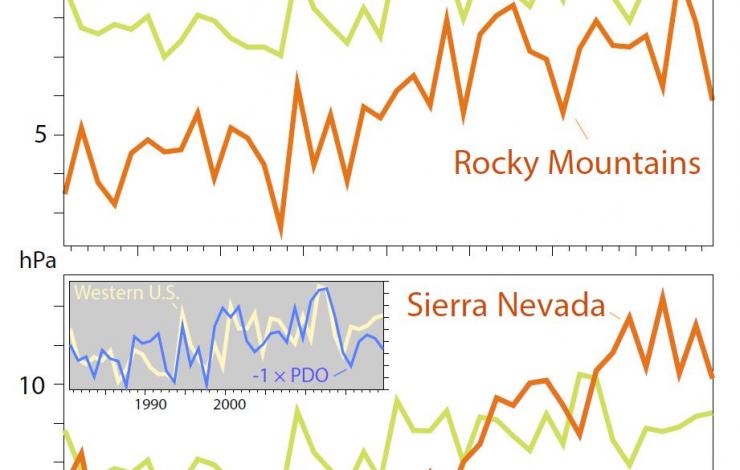
Focusing on the two areas with the biggest change in nighttime air — the Northern Rockies (orange line at top) and the southern Sierra Nevada (orange line at bottom) — shows much bigger changes in summer nighttime vapor pressure deficit than the average across the West (green line). The study finds a link between the average value across the West and the Pacific Decadal Oscillation, a long-term climate pattern shown in the inset.
Firefighters have reported that Western wildfires are starting earlier in the morning and dying down later at night, hampering their ability to recover and regroup before the next day’s flareup.
A study by NOAA Cooperative Institute at the University of Washington and U.S. Forest Service scientists shows why: The drying power of nighttime air over much of the Western U.S. has increased dramatically in the past 40 years. The paper was published online in July in Geophysical Research Letters.
“Nighttime is an important time in fire management. When fires die down at night it gives firefighters a chance to rest, move equipment and strategize. The problem firefighters are reporting is an unexpected increase in nighttime fire activity,” said lead author Andy Chiodi, a UW research scientist at the Cooperative Institute for Climate, Ocean & Ecosystem Studies and at NOAA's Pacific Marine Environmental Laboratory . “Our findings support that this has been going on over the last 40 years over much, but not all, of the Western U.S.”
Earth’s atmosphere is warming due to climate change, and warming in many places has been greater at night. Warmer night air had been suspected as the culprit altering the daily pattern of wildfire activity, with burns continuing later into the night. The new study, however, shows it’s not just that the night air is warmer, but also a dramatic shift from 1980 to 2019 in its drying power — how much moisture the nighttime air can carry away from the fuels — over much of the Western U.S. This shift is not captured in climate models, and the authors say it could be related to natural long-term cycles rather than to climate change.
“We paid special attention to the change in recent years compared to the conditions seen in the ’80s and ’90s, which is when many of the current firefighters started their careers, and presumably formed their ideas about what normal fire behavior should look like,” Chiodi said. “We tried to quantify the changes that we were hearing about from firefighters.”
Vapor Pressure Deficit
The study looks at the “vapor pressure deficit,” or the difference between the moisture in the air and the saturation moisture level at that air temperature. This difference is a measure of the air’s drying power.
“In the southern Sierra Nevada, the average summer nighttime vapor pressure deficit for the recent decade was 50% higher than the average in the ’80s and ’90s,” Chiodi said. “I was surprised — it’s unusual to see geophysical data change that dramatically.”
Some of this shift in vapor pressure deficit is happening because warmer nighttime air, caused by climate change, produce higher saturation values. But part of the drying power is happening because the nighttime air in some regions has less moisture, and that effect is not predicted by climate change models, at least this much or in this pattern. The authors find a possible connection to the Pacific Decadal Oscillation, a long-term cycle that can influence inland weather.
The increased drying power of nighttime air is especially pronounced in California’s San Fernando Valley and in the Bitterroot-Blue Mountain Region — including parts of the Idaho Panhandle, southeast Washington, northeast Oregon and western Montana.
“Firefighters had been saying for several years that they feel some fires burn later into the evening than they used to,” said co-author Brian Potter at the U.S. Forest Service’s Pacific Wildland Fire Sciences Laboratory. “We found that in some areas, the amount of water in the air is decreasing, sort of doubling up on the warmer nights. These areas, including where the Snake River Complex and Lick Creek fires are burning right now, are much more likely to have fires burn late into the night.”
The analysis used hourly weather outputs from the European Centre for Medium-Range Weather Forecasts. The recently released hourly reconstructions of historical weather allowed investigation of daily cycles. The next step, Chiodi said, is to further explore the causes of these changes in nighttime vapor pressure deficit. After that, he hopes to connect the atmospheric conditions more directly to fuel moisture and fire behavior.
The other co-author is Narasimhan ‘Sim’ Larkin at the U.S. Forest Service’s Pacific Wildland Fire Sciences Laboratory in Seattle. The research was funded by the U.S. Forest Service through its AirFire research team and by NOAA. Story originally posted by the University of Washington.