What's New Archive
![]() The U.S. government is closed. This site will not be updated; however, NOAA websites and social media channels necessary to protect lives and property will be maintained. To learn more, visit commerce.gov.
The U.S. government is closed. This site will not be updated; however, NOAA websites and social media channels necessary to protect lives and property will be maintained. To learn more, visit commerce.gov.
For the latest forecasts and critical weather information, visit weather.gov.
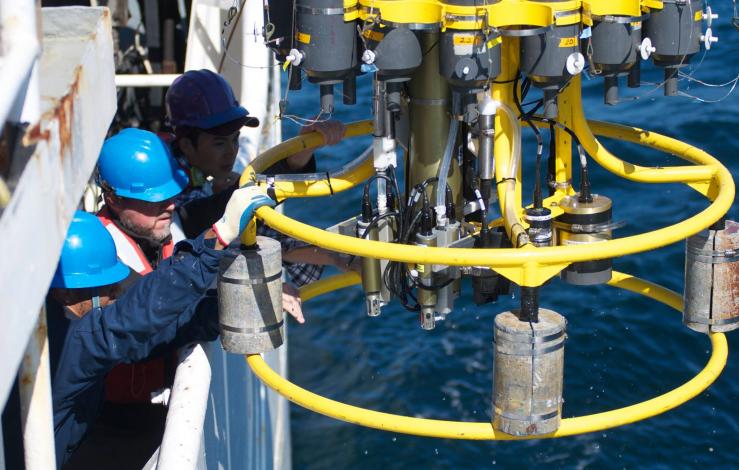
A Conductivity, Temperature and Depth (CTD) sampler is retrieved during the East Coast Ocean Acidification cruise that characterized marine carbonate parameters in the waters along the U.S. and Canadian coasts. Credit: NOAA
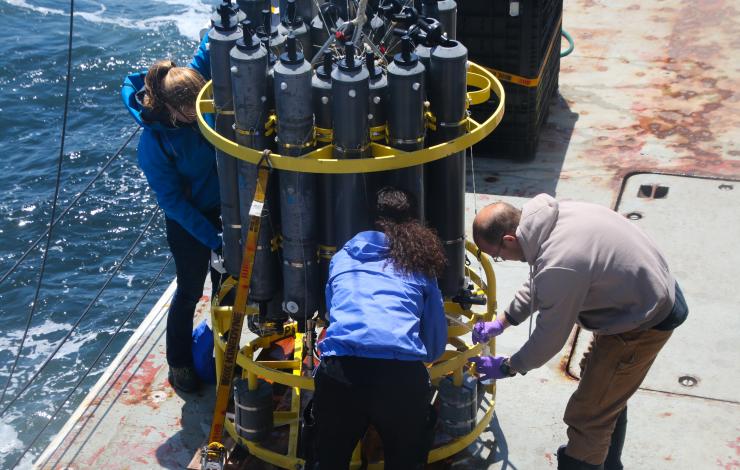
Scientists gather around a CTD during the West Coast Ocean Acidification Cruise to collect samples that measure concentrations of oxygen, pH, and carbon, salinity, chlorophyll and nutrients. Photo Credit: Meghan Shea/NOAA
New NOAA and partner research comparing ocean acidification around North America shows that the most vulnerable coastal waters are along the northern part of the east and west coasts. While previous research has looked at specific regions, the new study appearing in Nature Communications, is the first in-depth comparison of ocean acidification in all North American coastal ocean waters.
“Ocean acidification is everywhere, but this synthesis basically shows that, depending on the location, it can manifest very differently,” said Wei-Jun Cai, lead author and a professor at the University of Delaware School of Marine Science and Policy.
Ocean acidification, a global process in which the ocean absorbs carbon dioxide from the atmosphere, is occurring faster than at any time in the past 50 million years. The global rise in ocean acidity is fueled by human-created greenhouse gases. An estimated 25 percent of those emissions are absorbed by the ocean.
In the ocean waters off the United States east coast, the northbound Gulf Stream current brings warm waters from the tropics while the southbound Labrador Current brings cold waters from the Arctic and subarctic regions. The colder ocean temperatures along the northern part of the east coast take up more carbon dioxide from the atmosphere than do warmer waters along the southern east coast and Gulf of Mexico. This uptake of carbon dioxide accelerates ocean acidification, which can hamper the ability of shellfish, corals and other valuable marine species to build their shells and thrive.
On the west coast, ocean acidification is affecting the waters of the California Current, which extends from the United States - Canadian border to Baja California. The California Current is characterized by strong, cold currents, and wind-driven upwelling events. Upwelling brings colder, carbon-dioxide-rich subsurface waters to the ocean’s surface to replace surface water that has been pushed away by winds.
“The water from the subsurface has low pH and high carbon dioxide, which causes stress to the biological system,” said co-author Richard Feely of NOAA’s Pacific Marine Environmental Laboratory (PMEL). “So the combination of the uptake of anthropogenic carbon dioxide from the atmosphere and the upwelling of CO2-rich low-pH water from below leads to enhanced acidification in this region.”
The research team from NOAA, the University of Delaware, and scientists from Canada, Mexico, the United Kingdom, China and Taiwan based the new findings on data gathered during several research cruises between 2007 and 2018. A number of those cruises were led or supported by NOAA’s Pacific Marine Environmental Lab, Atlantic Oceanographic and Meteorological Lab and the Ocean Acidification Program. Other PMEL authors include Simone Alin, Jessica Cross, Brendan Carter (UW/JISAO) and Adrienne Sutton.
Read the full news release from the University of Delaware.
Read the paper in Nature Communications (an open access journal): Controls on surface water carbonate chemistry along the North American ocean margins
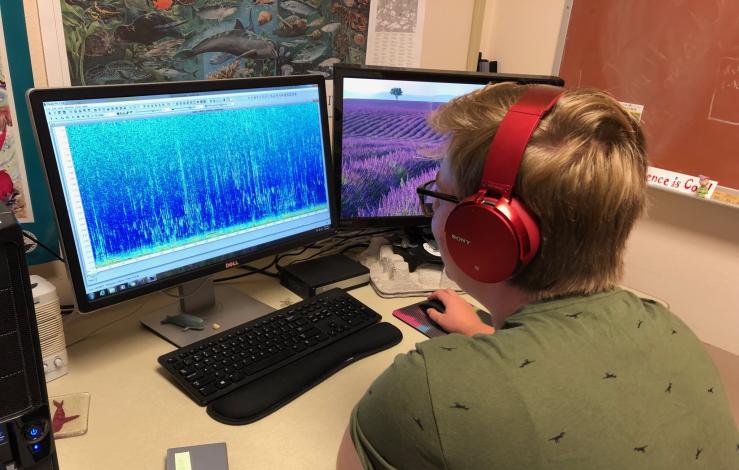
Zoe Rand, currently a master’s student at St. Andrews University, analyzing acoustic data last summer. Zoe was working with Samara Haver and the PMEL Acoustics Program in Newport to analyze whale vocalizations in Cordell Bank National Marine Sanctuary. Photo Credit: Samara Haver (OSU/NOAA PMEL).
The coronavirus pandemic response has reduced pollution from a large number of sources across many geographic regions. NOAA has launched a wide-ranging research effort to investigate the impact of reduced vehicle traffic, air travel, shipping, manufacturing, and other activities on Earth's atmosphere and oceans. Researchers are using the most advanced atmosphere-ocean models to look for changes in atmospheric composition, weather, climate, and precipitation over weeks to months. In the oceans, NOAA scientists will be assessing impacts of reduced underwater noise levels on marine life.
PMEL along with NOAA Fisheries Office of Science and Technology, NOAA Sanctuaries and Department of Interior’s National Park Service are collaborating to analyze data from hydrophones deployed around the United States coastal waters to measure changes and assess any impacts on fisheries and marine mammal activity due to reduced maritime transportation and other maritime activities.
Read the full story from NOAA Research.
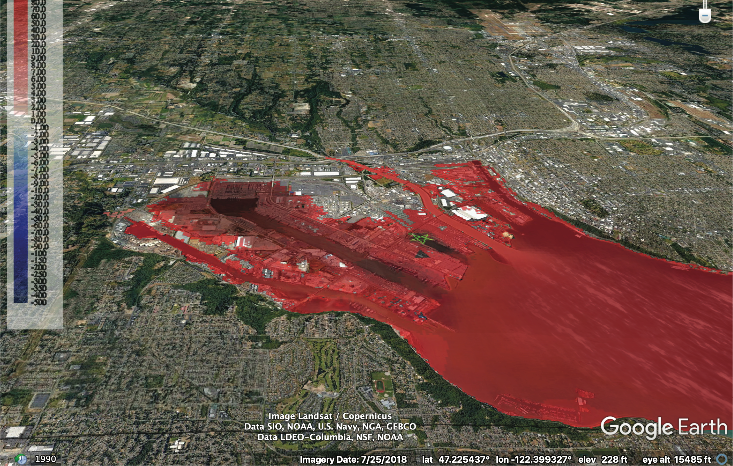
Tsunami test scenario for Bellingham (upper panel) and Tacoma (lower panel) forecast models. Tsunami amplitudes and inundation (red) are shown for the same M9.0 scenario of the Cascadia tsunami 3 hours after tsunami generation. Click on image to see both panels. These figures do not represent an actual forecast or quantitative hazard assessments for Tacoma and Bellingham, these are rather a test simulation of a potential tsunami scenario to verify the robustness of the forecast models.
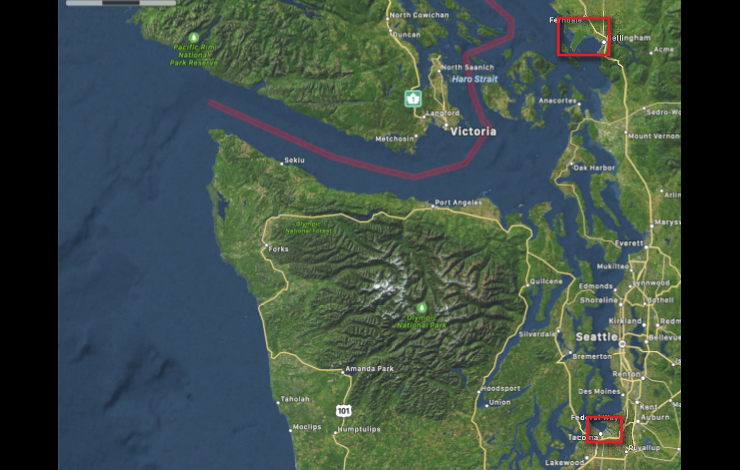
Locations of Bellingham and Tacoma forecast models. Inundation model computational domains are shown as red rectangles.
The main tsunami hazard for Washington State originates from a potential earthquake at the Cascadia Subduction Zone, which is stretched along the U.S. Pacific coasts offshore Washington, Oregon and Northern California. The main impact during such a tsunami event would be the ocean-side communities on the open coast. However, Washington State’s main population centers are located along Puget Sound, a long narrow inlet over 100 miles away from open coast and from potential Cascadia earthquake.
Recent tsunami mapping and tsunami hazard modeling efforts of the National Tsunami Hazard Mitigation Program have demonstrated that a Cascadia tsunami impact could be significant even for the coasts deep inside Puget Sound. Due to this need, the NOAA Center for Tsunami Research (NCTR) at PMEL developed high resolution tsunami inundation forecast models for Bellingham and Tacoma, Washington. These high-resolution community models are needed to improve the accuracy of the tsunami forecasts at NOAA’s Tsunami Warning Centers. Since 2012, NCTR has developed over 75 high-resolution inundation forecast models for the most vulnerable U.S. coastal communities and that number continues to grow.
While the tsunami wave amplitudes in Bellingham and Tacoma are expected to be lower in comparison with the outer coast communities during a Cascadia tsunami, the population density and potential local tsunami-genic faults within Puget Sound make these two cities high tsunami risk. Seattle would also see some impact but was not found to be as high risk from tsunami inundation as Tacoma or Bellingham.
The development of the Tacoma and Bellingham models included extensive testing with available historical tsunami data and included the dynamics from major harbor structures such as breakwaters. The forecast models are also constrained by run time and are developed to run in less than a minute. Figure 2 shows an example of model testing results, depicting snapshots of tsunami amplitudes for a Cascadia tsunami simulation 3 hours after a generated tsunami event. Tacoma wave amplitudes may reach above 5 meters for this scenario, while Bellingham shows above 4 meters of amplitudes for this scenario.
These models have been incorporated into real-time forecasting at the NOAA Tsunami Warning Centers. Prior modeling efforts used worst case scenarios and long-running higher resolution models for WA state emergency managers to develop evacuation plans for a Cascadia tsunami event.
NCTR is an integral part of the NOAA Tsunami Program and is involved in several tsunami hazard mitigation and risk reduction research programs with federal, state and international partners.
Read more about the methods and details about the forecast system here.
Aerosols are fine particles that are produced by waves breaking at the ocean surface (sea spray), phytoplankton (sulfate aerosol), sandstorms (dust), and combustion (burning of fossil fuels and wildfires). These microscopic particles can impact climate directly by absorbing or scattering incoming solar radiation and indirectly by affecting cloud properties such as extent, lifetime, and reflectivity. Aerosols also affect air quality by reducing visibility and, when inhaled, can affect our health.
The Atmospheric Chemistry Group at NOAA’s Pacific Marine Environmental Lab has been studying the effects of aerosols on climate and air quality by participating in shipboard national and international research field campaigns and long-term aerosol monitoring for over thirty years. Their work has employed the use of ships, unmanned aerial systems (UAS), and ground stations.
The group has studied a broad range of aerosol types ranging from remote marine aerosols in every ocean basin, black carbon (soot) in the Arctic, particulate matter in the oil and gas fields of Utah’s Uintah Basin to dust storms over Asia.
Check out our video on the NOAA YouTube Channel to learn more about NOAA PMEL’s research on aerosols: https://www.youtube.com/watch?v=pp_TdS8RPZI
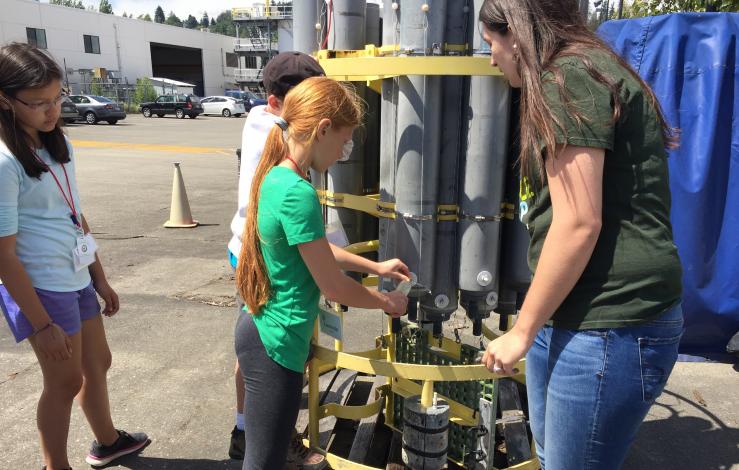
Middle school students taking water samples using a glass syringe from a CTD Rosette.
Online registration for the 2020 NOAA Science Camp is now open! NOAA Science Camp is held at the NOAA Western Regional Center in Seattle, WA and exposes middle school and high school students to the various research conducted at NOAA through hands-on science activities and emphasizing solutions to real-world scenarios. The Middle School Science Camp offers two, one-week sessions from July 6-10 and July 13-17, 2020. The Junior Leadership Program is a two-week program (July 6-17) for high school students entering grades 9-12 in the fall of 2020. Applications for the Junior Leadership Program are due on April 10th. Camp runs from 9 am to 4 pm each weekday. Scholarships are available for both programs.
PMEL scientists (NOAA and JISAO) lead activities relating to oceanography including what scientists do when they go to sea, various tools and techniques scientists use to study the ocean, and how currents and trace chemicals move throughout the ocean.
Learn more on the Washington Sea Grant site and register for NOAA Science Camp here.
Stacy Maenner Jones has been selected February's NOAA Employee of the Month!
Stacy is a Physical Scientist at PMEL in Seattle, Washington, where she has been instrumental in the development of the moored and autonomous ocean CO2 program, and coordinates the program’s observations, timely public access to real-time and finalized data, and sensor and observing platform development. Stacy is an essential liaison among engineers, industry partners, and scientists around the world, and has made NOAA’s moored CO2 observations central to the global surface ocean CO2 network. Last year, Stacey made major contributions to six Saildrone missions, including the first autonomous Antarctic circumnavigation, and oversaw a 550-day Wave Glider mission in an area where there was a critical surface ocean CO2 observational gap in the South Pacific Ocean. Moreover, Stacy led the testing and validation of a new autonomous surface ocean CO2 sensor, which NOAA has begun sharing with partners and stakeholders. Stacy’s wealth of institutional knowledge and her facility with handling complex technical issues is critical to meeting NOAA’s goals of understanding changing ocean and climate conditions, and supporting healthy oceans, coastal ecosystems, and marine resources.
Congratulations, Stacy!
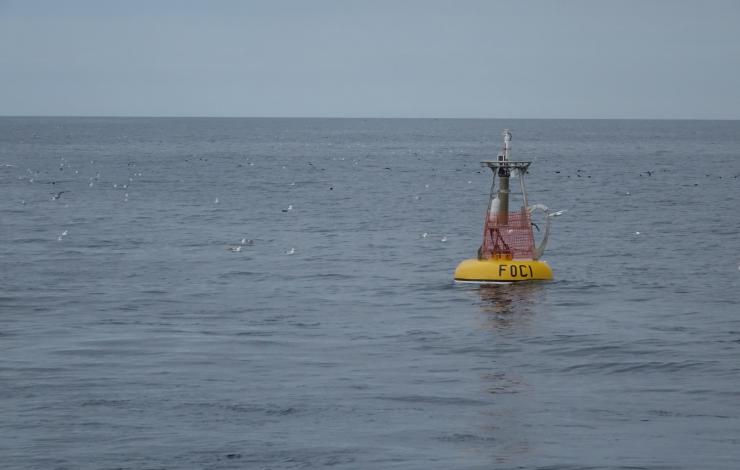
EcoFOCI maintains an array of four moorings on the southeastern Bering Sea Shelf that collect year-round measurements to better understand the mechanisms and changes that may impact the productive marine ecosystem.
The northern Bering and Chukchi Seas are among the world’s most productive ocean areas. They are home to millions of seabirds and marine mammals and vibrant Indigenous cultures. The region has also long been one of the fastest warming places on the planet. In a recnetly published paper in Nature Climate Change, a multi-disciplinary team of academic, government, and private sector scientists reports that dramatic changes in these Arctic ecosystems due to warmer ocean conditions. The scientific team, participating in a four-year Arctic Integrated Ecosystem Research Program, observed conditions more typical of subarctic ecosystems.
"The rate of change over the study timeframe came as a shock. Having a team with the expertise to put together the pieces across the whole ecosystem simply drives home how far-reaching the changes are and how much they matter," said Henry Huntington, lead author of the study.
Some key observations over the past several years of the study include:
- Near-bottom waters that typically remained close to freezing year-round have in the past four years warmed for several months in the summer and fall.
- Sea ice that used to start forming each fall has been absent or sparse into January and February and the spring ice retreat was earlier than normal in recent years.
- Juvenile Arctic Cod, which dominate pelagic fish communities in the northern Chukchi Sea, were substantially more abundant in 2017 than in 2012 and 2013.
- In 2017 pink salmon were observed to have increased dramatically in abundance in the northern Bering Sea
- Bowhead whales that typically migrate south of St. Lawrence Island were observed year-round north of the Bering Strait.
- Ice seals were absent from vast portions of some of their main breeding areas, and dead seals were reported in unusually high numbers on the Bering and Chukchi coasts.
The North Pacific Research Board, in cooperation with other organizations funded the Arctic Integrated Ecosystem Research Program. The goal of the program was to better understand the mechanisms and processes that structure the ecosystem and influence the distribution, life history, and interactions of biological communities in the Chukchi Sea. Previous integrated ecosystem programs were undertaken in the Bering Sea and Gulf of Alaska.
The big question for scientists remains whether these changes reflect a new norm. Collaborative research efforts like this are important because they allow scientists to monitor changes as they are happening and provide meaningful information to local communities and resource managers so they are better able to respond and adapt.
The team of authors includes physical and biological oceanographers, ichthyologists, ornithologists, marine mammalogists, marine ecologists, and social scientists, from the University of Alaska Fairbanks, the University of Washington, the National Oceanic and Atmospheric Administration, the Alaska Department of Fish and Game, the North Slope Borough Department of Wildlife Management, the North Pacific Research Board, Stantec, and Huntington Consulting.
PMEL's EcoFOCI program was involved with the study. EcoFOCI is a joint research program between NOAA's Pacific Marine Environmental Lab and NOAA's Alaska Fisheries Science Center. EcoFOCI scientists integrate field, laboratory and modeling studies to determine how varying biological and physical factors influence large marine ecosystems within Alaskan waters.
Read the full press release here.
41 scientists from PMEL, including scientists from NOAA's cooperative institutes at the University of Washington's Joint Institute for the Study of the Ocean and Atmosphere (JISAO) and Oregon State University's Cooperative Institute for Marine Resources Studies (CIMRS), the National Research Council, graduate and undergraduate students are heading to the Ocean Sciences Meeting in San Diego to share their current research. Talks and posters cover a range of topics include saildrone research, ocean observing systems, marine heatwaves, Arctic, acoustics, Deep Argo, genetics and genomics, El Nino, hydrothermal vents, methane, nutrients, technologies, ocean carbon and data management.
The 2020 Oceans Science Meeting is the flagship conference for the ocean sciences and the larger ocean-connected community. As we approach the UN Decade of Ocean Science for Sustainable Development, beginning in 2021, it is increasingly important to gather as a scientific community to raise awareness of the truly global dimension of the ocean, address environmental challenges, and set forth on a path towards a resilient planet. The meeting is co-sponsored by the American Geophysical Union (AGU), the Association for the Sciences of Limnology and Oceanography (ASLO), and The Oceanography Society (TOS).
PMEL research groups that will be present at the conference are: Acoustics, Arctic including Innovative Technology for Arctic Exploration, Climate-Weather Interface, Earth-Ocean Interactions, EcoFOCI, Engineering, Genetics and Genomics, Global Tropical Moored Buoy Array, , Large Scale Ocean Physics, Ocean Carbon, Ocean Climate Stations, Pacific Western Boundary Currents, and Science Data Integration Group.

The TELOS protoype mooring interfaces with multiple sensors on the mooring line collecting, storing and transmitting the data in real-time.
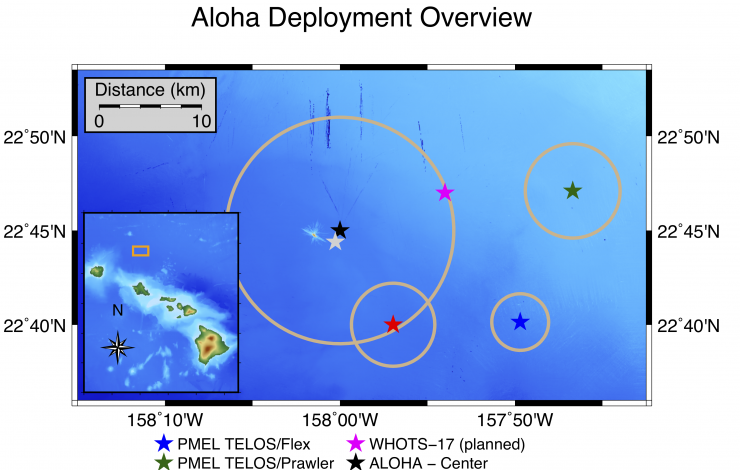
Map of two PMEL prototype TELOS moorings deployed east of Station ALOHA (blue and green stars).
On November 20, 2019, a team of PMEL scientists, engineers, and technicians successfully deployed two deep water oceanographic moorings off the coast of Hawaii to test PMEL’s newest data acquisition system, known as TELOS (Telemetry, Electronics & Logging of Oceanographic Sensors). The “brain” behind oceanographic data collection, TELOS interfaces with the atmospheric and oceanic sensors aboard the moorings -- collecting, storing, and transmitting measured data in real-time via satellite telemetry.
Station ALOHA, located 90 miles north of Oahu, is a well-established hub of ocean research. The site contains a cabled array seafloor observatory, a Woods Hole Oceanographic Institution surface mooring (WHOTS), long-range profilers, autonomous gliders, and other equipment. With the abundance of ocean observations on site, frequent ship visits, and ease of access from a US port to ocean depths greater than 4,500 meters (nearly 3 miles), the site offers an ideal testbed to evaluate the new TELOS technology.
The two deployments near Station ALOHA represent the first-ever open-ocean moorings with TELOS. One mooring contains a standard set of 13 line-mounted temperature/salinity instruments at depths ranging from 1 meter to 500 meters, two current meters, and a full suite of six meteorological instruments similar to the instrumentation on well-established Global Tropical Moored Buoy Array and Ocean Climate Stations moorings. A backup data acquisition system with a duplicate suite of six meteorological instruments is deployed on this mooring for comparison to an established control system. The second mooring also includes the standard set of 6 meteorological instruments and features a PMEL subsurface Prawler device that crawls up and down the mooring line, transmitting upper-ocean temperature/salinity profile data and potentially replacing the need for multiple in-line instruments. Both moorings will be evaluated over the 1-year deployment period to compare the data acquisition systems, using measurements from both moorings as well as the WHOTS mooring for additional comparison. TELOS has already demonstrated the capability to collect, process, and return higher volumes of real-time data than previous data acquisition systems, with the additional capacity for integrating new instrumentation.
So far, the mission has been a success. High-resolution real-time data are transmitted to PMEL via satellite, and scientists are developing visualization tools and analyzing data quality. The full data payload will be downloaded from the moorings in late 2020, testing the ability to survive a yearlong deployment at sea. If successful, TELOS will be scaled up for implementation across the PMEL mooring networks, transforming the future of oceanographic data collection.
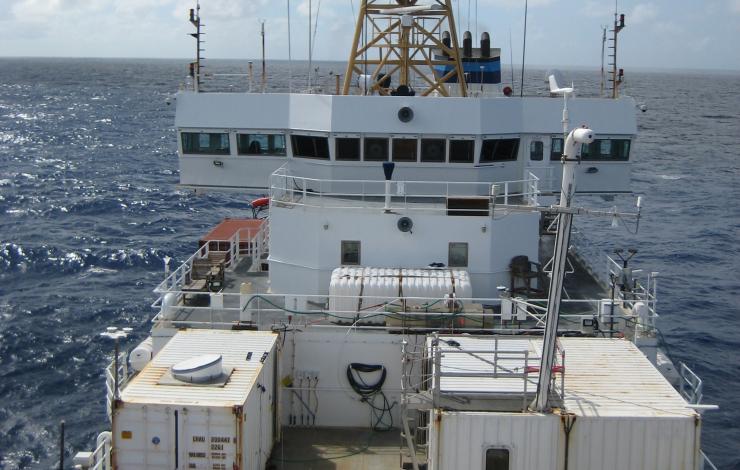
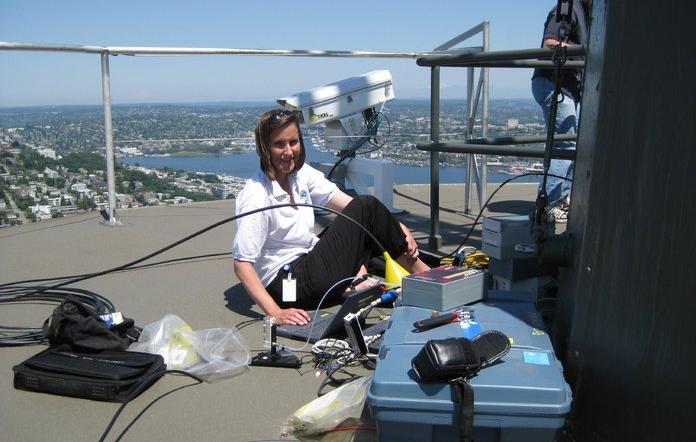
A view of the ship from the top of the forward mast. From left to right on the lower deck is the NOAA ESRL radar container with upward-pointing W-band radar measuring clouds and rain, the NOAA ESRL CSD lidar measuring wind, aerosol and clouds, and the NOAA PMEL air quality sampling van with aerosol inlet. (Photo: Sergio Pezoa)
Scientists will use instruments aboard NOAA Ship Ronald H. Brown, NOAA WP-3D Orion aircraft, several autonomous vehicles, as well as ocean surface floats to investigate how the ocean, atmosphere, and shallow clouds work together to create the weather and climate we live in.
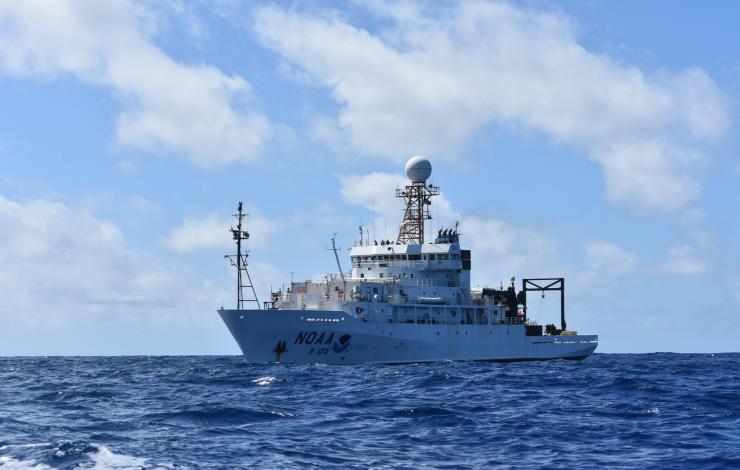
PMEL's Atmospheric Chemistry Group has been participating in the Atlantic Tradewind Ocean-Atmosphere Mesoscale Interaction Campaign (ATOMIC) onboard the RV Ronald H. Brown in the tropical North Atlantic east of Barbados.
The six-week scientific campaign involves a unique combination of manned and unmanned aircraft and ships including newly developed capabilities using UAVs, saildrones, and underwater gliders to investigate how the ocean, atmosphere, and shallow clouds work together to create the weather and climate we live in. Scientists are gathering information on shallow convection clouds, the effects of aerosols and clouds on the ocean surface energy budget, and mesoscale oceanic processes – all of which are relevant to the propagation of Madden-Julian Oscillations (MJOs), hurricane track and intensity, annual movement of the Intertropical Convergence Zone (ITCZ), midlatitude storm tracks, and marine stratocumulus cloud regions.
PMEL is measuring aerosol properties including number concentration as a function of particle size, chemical composition, scattering and absorption of solar radiation, and cloud drop nucleating ability. These data will be used to investigate the impacts of aerosol particles on the region’s radiation budget and, in turn, the impact of atmospheric dynamics on aerosol properties.
ATOMIC is the U.S. component of a collaborative effort that includes Germany, France, United Kingdom, United States, and Barbados called EUREC⁴A (Elucidating the Role of Clouds-Circulation Coupling in Climate). Together, ATOMIC and EUREC4A will involve 4 research vessels, 4 research aircraft (including the NOAA P3), land-based observations from Barbados, and unmanned sea-going vehicles. ATOMIC involves experts from NOAA (PMEL and ESRL), NOAA pilots and crew, the Caribbean Institute for Meteorology and Hydrology, several universities, and other partners.
Dr. Patricia Quinn has been serving as Chief Scientist for Leg 1. Read more on NOAA research: https://research.