High frequency observations are critical for characterizing the natural variability and secular trends in the ocean carbon cycle.
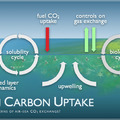
Ocean carbon measurements have shown significant biogeochemical variability over a wide range of timescales from sub-diurnal to decadal periods. In situ measurements are also providing a growing body of evidence that episodic phenomena are extremely important causes of variability in CO2 and related biogeochemical properties. Time-series records are essential for characterizing the natural variability and secular trends in the ocean carbon cycle and for determining the physical and biological mechanisms controlling the system. The biological and chemical responses to natural perturbations (e.g., El Niño/Southern Oscillation, dust deposition events) are particularly important with regard to evaluating potential responses to anthropogenic forcing and for evaluating the prognostic models used in future climate projections. Ship-based time-series measurements are impractical for routinely measuring variability over intervals from a week to a month, they cannot be made during storms or high-sea conditions, and they are too expensive for remote locations. Instrumental advances over the past 15 years have led to autonomous moorings capable of sampling properties of chemical, biological, and physical interest with resolutions as good as a minute and duty cycles of a year or more. Although these new technologies are still underutilized, they have been identified as a critical component of the global ocean observing system for climate.
MISSION STATEMENT
The primary mission of this project is to evaluate the variability in air-sea CO2 fluxes by conducting high resolution time-series measurements of atmospheric boundary layer and surface ocean CO2 partial pressure (pCO2).
BACKGROUND
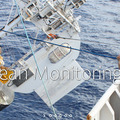
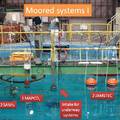
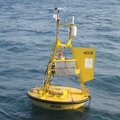
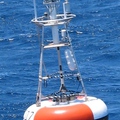
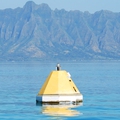
Developed at Monterey Bay Aquarium Research Institute (MBARI) in the 1990s and modified by PMEL in the early 2000s, the Moored Autonomous pCO2 (MAPCO2®) system is currently deployed on over 50 surface buoys worldwide. What distinguishes a MAPCO2® system is the measurement and calibration protocol described in detail in this open access paper. Along with pCO2 measurements on Volunteer Observing Ships, these MAPCO2 buoy sites make up the Surface Ocean CO2 Observing Network (SOCONET), and the data can be found via the Surface Ocean CO2 Atlas (SOCAT) and NOAA’s National Center for Environmental Information (NCEI), including in the form of an easy-to-access time series data product.
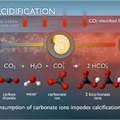
In the late 2000s, we started to augment the NOAA network of MAPCO2 buoys with additional sensors to track ocean acidification. This network is primarily supported by NOAA’s Ocean Observing and Monitoring Division, Ocean Acidification Program, >30 other U.S. and international partners.
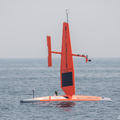
We have also modified the MAPCO2 system for deployment on Autonomous Surface Vehicles (ASV). These ASVCO2® systems have been deployed on Wave Glider missions as early as 2011 and on Saildrone missions starting in 2017. Measurement and calibration protocol for the ASVCO2® is the same as for the MAPCO2®.
The types of moored time series generally fall into three categories: Open Ocean, Coastal, and Coral Reef. See the descriptions of each as well as the ASV work below. For questions about these technologies or NOAA’s moored pCO2 and ocean acidification network, contact Adrienne Sutton.
DATA ACCESS
There are several ways to access data from the CO2 and ocean acidification buoy network:
- Detailed data and metadata for each annual buoy deployment are available organized by ocean basin at NCEI.
- One file containing a time series of all quality-controlled temperature, salinity, and carbon observations are organized by buoy location in human-readable tab-delimited files or via ERDDAP. These provide easier access to standardized, climate-quality surface ocean carbon time series.
- Gridded and synthesis files in a variety of formats are available through SOCAT. This is ideal if interested in all data from all platforms in a specific region.
You can now access ASVCO2 data through NCEI and through the latest version of SOCAT.

