What's New Archive
![]() The U.S. government is closed. This site will not be updated; however, NOAA websites and social media channels necessary to protect lives and property will be maintained. To learn more, visit commerce.gov.
The U.S. government is closed. This site will not be updated; however, NOAA websites and social media channels necessary to protect lives and property will be maintained. To learn more, visit commerce.gov.
For the latest forecasts and critical weather information, visit weather.gov.
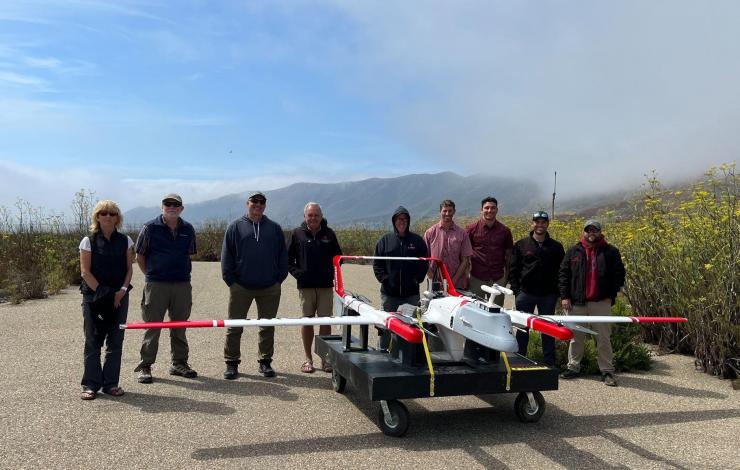
NOAA and Overwatch Aero personnel gather around the FVR-90 uncrewed aircraft before a flight at Vandenberg Space Force Base. Photo: Tina Fuss (NOAA)
July 17 to Aug. 4, 2023: A team of NOAA and industry uncrewed aircraft professionals conducted flight operations at Vandenberg Space Force Base in Lompoc, California, to expand and test the use of uncrewed aircraft to gather critical observational data. During the flight operations, NOAA’s Pacific Marine Environmental Lab (PMEL), the Uncrewed Aircraft Systems Division of NOAA's Uncrewed Systems Operations Center, and their industry partner Overwatch Aero tested PMEL’s science payloads onboard the hybrid FVR-90 Vertical Take Off and Landing - Fixed Wing uncrewed aircraft. The payloads, aptly named Clear Sky and Cloudy Sky, measure aerosol and cloud properties and the impact of aerosols on the Earth’s radiation budget.
These payloads can help NOAA address many areas of interest such as air quality, the role of aerosols in Earth’s energy budget, and atmospheric interactions. Aerosols are fine particles that are produced by waves breaking at the ocean surface (sea spray), phytoplankton (sulfate aerosol), sandstorms (dust), and combustion (burning of fossil fuels and wildfires). These microscopic particles can impact climate directly by absorbing or scattering incoming solar radiation and indirectly by affecting cloud properties such as extent, lifetime, and reflectivity. Aerosols also affect air quality by reducing visibility and, when inhaled, can affect our health. Deployment of these science payloads on uncrewed aircraft supports NOAA’s mission to understand and predict changes in climate, weather, the ocean and coasts.
The Vandenberg flight operations build on earlier efforts by NOAA to use uncrewed aircraft to measure aerosol and cloud properties. The FVR-55, a smaller counterpart of the FVR-90, was developed by L3Harris (previously Latitude Engineering, LLC) through NOAA’s Phase I and II Small Business Innovation Research awards.
In 2022, the smaller uncrewed aircraft conducted fully autonomous shipboard operations and beyond visual line of sight shore-based operations with the Clear Sky and Cloudy Sky payloads onboard. By using uncrewed aircraft launched from ships, NOAA is able to gather vertical profiles of aerosol and cloud properties more flexibly and efficiently than traditional sampling. Transitioning from the FVR-55 to the FVR-90 allows for longer duration flights and the addition of more instrumentation to the Clear and Cloudy Sky payloads.
During the flight operations, the uncrewed aircraft completed 15 flights and 46 hours of flight time in which the systems and science payloads were tested. Some flights lasted over four hours and at altitudes of 350-11,000 feet above sea level. The Clear Sky payload was flown up to 10,000 ft to identify aerosol layers in the atmosphere and to measure the absorption and scattering of solar radiation by those layers. Overall, the operations moved the team one step further in achieving their ultimate goal of launching the payloads onboard the FVR-90 from NOAA ships to complement surface measurements of aerosol properties.
The Atmospheric Chemistry Group at NOAA’s Pacific Marine Environmental Lab has been studying the effects of aerosols on climate and air quality by participating in shipboard national and international research field campaigns and long-term aerosol monitoring for over thirty years. Their work has employed the use of ships, uncrewed aerial systems (UAS), and ground stations. Learn more about the research conducted by PMEL's Atmospheric Chemistry Group on their webpage and watch a video highlighting the importance of the work.
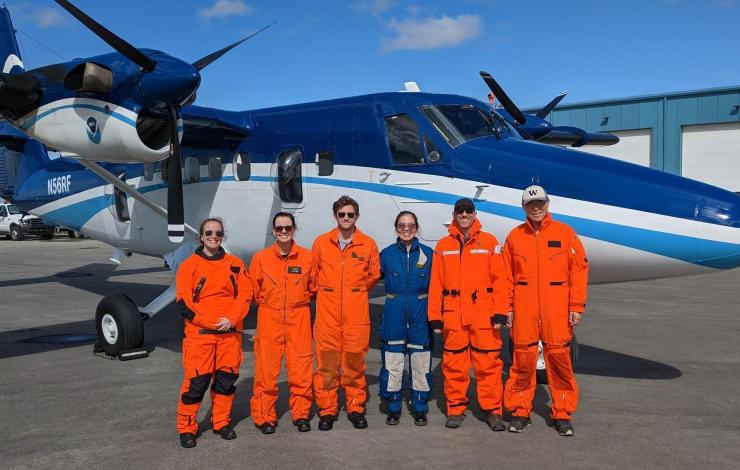
The 2023 June Arctic Airborne Investigations and Research crew consisted of staff from NOAA's Pacific Marine Environmental Laboratory, NOAA Office of Marine and Aviation Operations and University of Washington. They flew over the Southern and Central Chukchi Sea and coordinated overflights with R/V Sikuliaq.
From left to right: Denise Miller (OMAO), Sarah Cozart (OMAO), Nicholas Underwood (OMAO), Jiaxu Zhang (UW/CICOES and NOAA PMEL), Michael Steele (UW/APL), and Zheng Liu (UW/APL). Photo credit: Brent Schoumaker (OMAO)
NOAA and partner scientists recently completed two successful field tests in the US Arctic merging new technologies and traditional ship surveys to assess real-time phytoplankton species distributions in response to surface warming.
The rapid warming of the Arctic Ocean has led to earlier sea ice retreats in spring and later arrivals in fall. This shift has prompted significant changes in phytoplankton communities, which is a critical measurement to understand ecosystem health.
In June 2023, 60 nautical miles of flights were coordinated with a research ship operating in the survey region to use a multispectral camera, the first of its kind. This provided an opportunity for scientists to distinguish phytoplankton species and physical characteristics in the Chukchi Sea.
The team from NOAA and the University of Washington tested a cutting-edge imaging system, to observe distributions of phytoplankton from the NOAA Twin Otter using a hyperspectral camera. The camera uses a sensor that takes many pixelated images that translate to an absorption spectrum based on the colors the phytoplankton reflects. The hyperspectral camera uses reflectiveness of the ocean to identify species and how much area they cover. It can be used to identify phytoplankton groups based on their pigment information. This emerging research method alongside the upcoming launch of the NASA PACE satellite may allow scientists to assess biodiversity in the ocean and in food webs and detect water quality issues such as harmful algal blooms (HABs).
This September 2023, additional flights were coordinated with the NOAA Arctic & Ecosystem Research Cruise on the R/V Sikuliaq to enable comparisons between the aircraft and ocean measurements. Adding in hyperspectral data provides a trifecta of sources to support monitoring of phytoplankton in the region. Satellite imagery can detect possible algal blooms, and ship-based samples can capture images in which species can be identified.
The combination of these technologies may provide the groundwork for the monitoring and managing of algal blooms in the US Arctic.
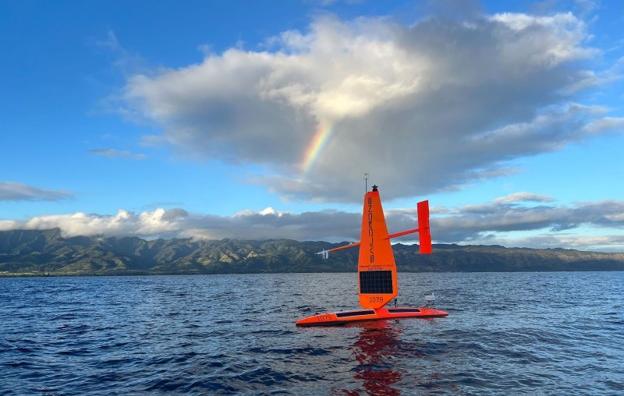
SD 1079 deploys in Hawai'i with a rainbow seen in the background. Courtesy Saildrone, Inc..
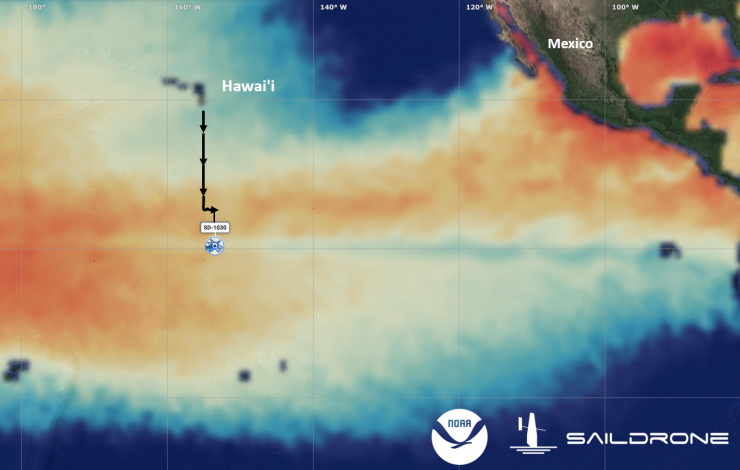
The three Saildrone, Inc. uncrewed surface vehicles were launched from Hawai‘i and currently are at the equator in the central Pacific observing the developing El Niño. Sea Surface Temperature (SST) warmer than 90°F is shown in dark red. SST cooler than 70°F is shown in dark blue. This image was generated within the Saildrone, Inc. mission portal using the SST analysis from the HYCOM ocean prediction system. Click to enlarge map.
The 120-day Tropical Pacific Observing System (TPOS) 2023 Saildrone Mission officially began on June 22, 2023, just after the official start of what experts suggest may be a strong El Niño. The three Saildrone, Inc. Explorer-class Uncrewed Surface Vehicles (USVs), launched from Honolulu, Hawai‘i, are now at the equator in the central Pacific (~155°W), about 1,300 miles south of the Hawaiian Islands. An El Niño state occurs when above-average equatorial sea surface temperatures are present throughout the central and eastern tropical Pacific, leading to a weakening or even reversal of the trade winds near the equator and anomalous weather patterns across the world.
Each USV is outfitted with a suite of sensors to monitor wind stress, air-sea exchanges of heat and carbon dioxide, and surface seawater temperature, salinity, and biogeochemistry. In addition, two of the drones will profile ocean currents to about 100 m depth, while the third will profile the distribution of organisms on a range of trophic levels down to 1,000 m depth.
Overall, this sixth TPOS mission uses Saildrone, Inc. USV for: (a) observing the air-sea interactions, including potential equatorial upwelling, associated with the evolving El Niño system, (b) observing the relaxation of carbon dioxide outgassing from the Tropical Pacific often associated with El Niño events, and (c) supplementing ship-based acoustic fish surveys to assess the distribution of organisms in the water column.
This TPOS mission marks a new collaboration between the NOAA Pacific Marine Environmental Laboratory TPOS team and Dr. Réka Domokos of NOAA Pacific Islands Fisheries Science Center. The Science Center produces science to support the conservation and management of the fisheries and many marine resources in the Pacific Islands Region. “The addition of the acoustic echosounder will allow us to explore the value and feasibility of using long-range USVs to assess the effects of the physical environment on biomass and distribution of organisms within the remote Pacific Islands Regions during a collaborative effort,” said Dr. Domokos. Ultimately, the goal for this new collaboration is to better connect the life cycle with the energy, water, and carbon cycles, thereby improving ecosystem forecasts within Earth system models.
This 120-day mission is supported by NOAA Uncrewed Systems Operations Center and NOAA Uncrewed Systems Research Transition Office. The TPOS mission brings together academic, industry, and international partners with NOAA partners from Research, the Weather Service, Marine and Aviation Operations, and now Fisheries line offices. It highlights NOAA’s efforts to increase innovative applications of uncrewed systems technologies through purchasing data using public-private partnerships and collaboration with academia.
To follow the progress of our mission, visit our blog: https://www.pmel.noaa.gov/ocs/ocs-saildrone-mission-blog-tpos-2023-mission
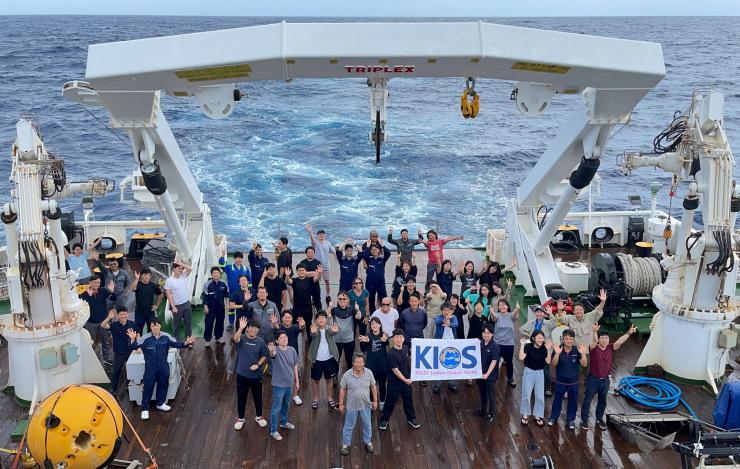
Group photo of RAMA/KUDOS/KIOS research cruise participants aboard the R/V ISABU in June 2023. Photo Credit: Chang-yeol Lee (Korean Educational Broadcasting System)
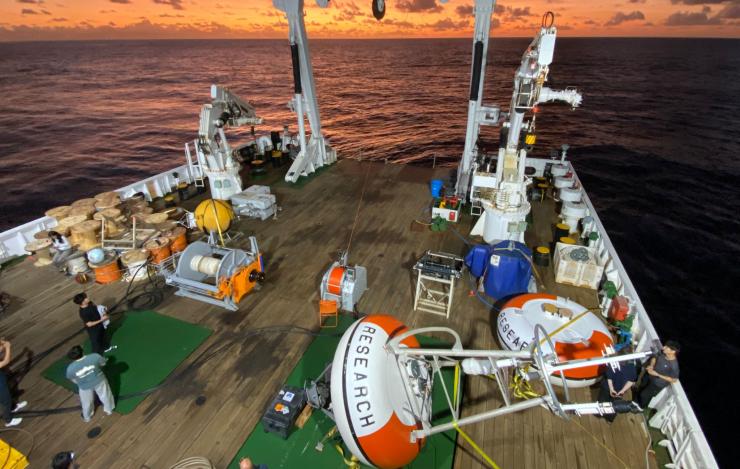
RAMA moorings staged on the aft deck of the R/V ISABU in preparation for deployment. Photo Credit: Tara Clemente (UW CICOES/NOAA PMEL)
May 15 – June 11, 2023: The Korea Institute of Ocean Science and Technology (KIOST) recently hosted NOAA’s Pacific Marine Environmental Laboratory (PMEL) on a research cruise aboard the KIOST ship R/V ISABU to maintain moorings as part of the multi-national Research Moored Array for African-Asian-Australian Monsoon Analysis and Prediction (RAMA).
One third of the world population depends on monsoon driven rainfall for agricultural production. RAMA provides crucial data in the traditionally data sparse Indian Ocean to better improve our understanding of the Indian Ocean’s role in the monsoons and support monsoon predictions.
PMEL staff Tara Clemente and Mike Strick participated on the research cruise and led the RAMA moored buoy operations. The team successfully deployed three RAMA moored buoys at 12°S 65°E, 8°S 65°E, and 4°S 65°E and deployed one subsurface ADCP mooring at 8°S 65°E. In addition to the moored buoy objectives, PMEL staff deployed eight (8) Lagrangian drifter buoys in support of the NOAA’s Global Drifter Program (GDP).
The three moored buoy sites deployed along 65°E are newly established mooring sites relocated from previously occupied mooring sites along 67°E. The new locations for these RAMA moorings are intended to better coordinate the joint Korea-U.S. Indian Ocean Scientific (KUDOS) Research Program and the KIOST Indian Ocean Study (KIOS) in the Seychelles-Chagos Thermocline Ridge region. An area around 8°S, 65°E has been established as the “RAMA K study site” and KIOST will be relocating additional subsurface moorings to this location in 2024.
Another notable event during this cruise was the recovery of the mooring from 8°S, 67°E that had gone adrift on 18 September 2022. The ISABU was able to intercept the drifting buoy and safely recover the buoy, sensors, and high-resolution data on board.
NOAA PMEL is grateful for the partnership with KIOST and wishes to commend the crew of the ISABU and the participating scientists for a successful RAMA/KUDOS/KIOS cruise.
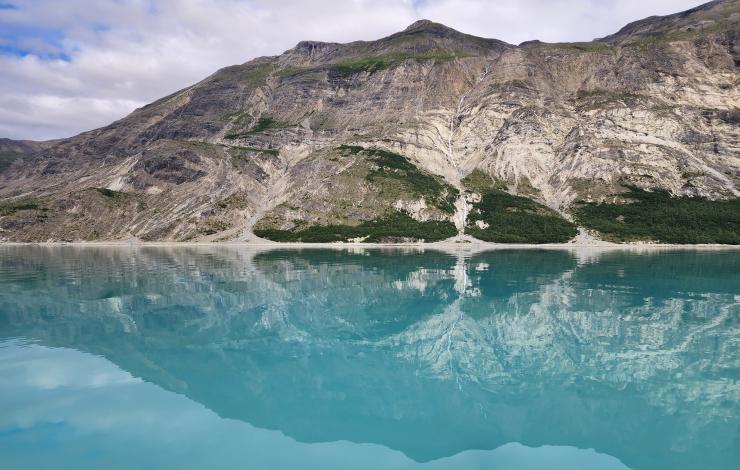
Glacial silt photographed from R/V Rachel Carson in Glacier Bay National Park, 2022. The natural addition of glacial silt colors coastal waters and is a potential analog for ocean alkalinity enhancement, a CDR technique, as it increases the alkalinity in the marine environment. Increasing ocean alkalinity shifts natural air-sea CO2 exchanges in favor of enhanced ocean storage. Photo Credit: Marina May (University of Washington / NOAA).
Climate change already affects every part of the globe, with potentially dire consequences for many ecosystems and human communities. Reducing human-caused emissions of greenhouse gasses, including carbon dioxide, is the most important strategy for addressing the impacts of climate change, and the most feasible given current technology. Alongside emissions reductions, the IPCC recommends that climate interventions like carbon dioxide removal (CDR) will be needed to meet climate targets and begin to stabilize Earth’s climate system.
CDR refers to a portfolio of techniques that are used to remove greenhouse gases from the atmosphere and lock them away permanently in secure reservoirs, such as the ocean, forests, soils and geologic formations. While negative emissions technologies such as carbon removal techniques are still in the early stages of development in most cases, the body of research and interest around these techniques is growing fast.
Today, NOAA released a report outlining its Carbon Dioxide Removal Strategy which identified and explored 11 removal techniques. The report does not endorse any one technique but rather outlines the relative strengths and weaknesses of each technique and describes NOAA’s potential research contributions. The effort was led by NOAA’s Pacific Marine Environmental Laboratory and involved contributions from across the agency, including more than 60 technical experts, 33 primary authors, and a 10-member executive advisory board.
“After two years of working with our partners in other agencies, private industry, NGOs, and the public, it’s exciting to showcase new ways NOAA’s mission can support the new blue economy.” says Jessica Cross, Carbon Dioxide Removal Co-Lead at NOAA’s Ocean Acidification Program and lead author of the strategy.
NOAA is well-positioned to lead in the analysis of impact, effectiveness, feasibility, and risk of many CDR techniques to understand the climate benefits and economic potential of carbon management. NOAA’s existing and innovative assets, such as long-term observations, models, ecosystem assessments, and spatial planning tools can inform evidence-based decisions. Those decisions, in turn, could be used by many in the carbon removal sector, including state and local governments, private sector entities and non-profit organizations, as well as other federal agencies.
To support these efforts, the NOAA Ocean Acidification Program, on behalf of that National Oceanographic and Partnership Program, announced a $24 million funding opportunity for proposals focused on Marine Carbon Dioxide Removal (mCDR) to support informed decisions regarding a potential scaled negative carbon ocean industry. Announcement of the awards will be in late summer 2023.
NOAA PMEL, in partnership with academic institutions, Pacific Northwest National Laboratory, and startup companies are modeling and measuring the effectiveness of electrodialysis-based ocean alkalinity enhancement for ocean acidification mitigation and atmospheric carbon dioxide removal. This work is supported by NOAA’s Ocean Acidification Program, ClimateWorks Foundation and Department of Energy’s Water Power and Technology Office.
Join NOAA, this Wednesday, June 7 from 4:45-5:30 pm ET for a free, virtual panel at Capitol Hill Ocean Week to hear about the finalized strategy, NOAA’s Climate Ready Nation targets, climate intervention programs and from NOAA’s partners in CDR research.
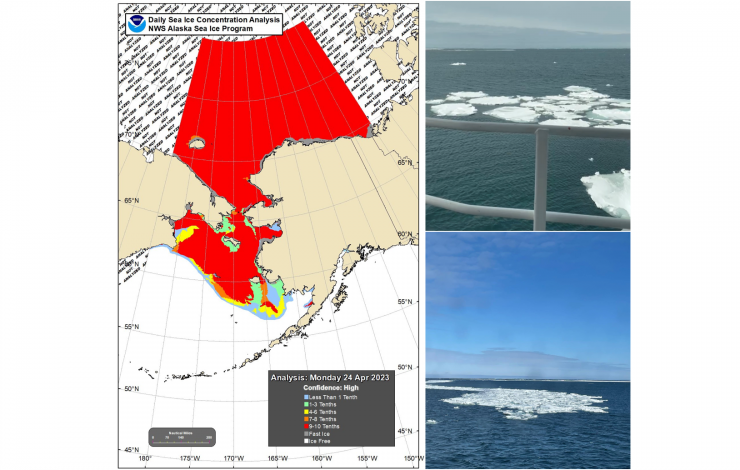
Annual Ecosystems & Fisheries-Oceanography Coordinated Investigations (EcoFOCI) Survey in the Bering Sea encounters sea ice (right images) for the first time since 2012. The map (left) shows sea ice extent in the region on April 24, 2023. Photo Credits: Shaun Bell
April 21 - May 8 - NOAA PMEL oceanographers and colleagues continue leading an annual effort to collect key data in understanding the Bering Sea. This important research cruise provides key insights to monitor events such as sea-ice loss and the cold pool in the region and how these are impacting the Arctic ecosystem. This year’s cruise started out a bit different!
For the first time since 2012, the ice extent in the Bering Sea is impacting the survey and researchers had to alter their cruise plan as the ice is at and around several of the mooring and sampling sites. While not thick ice, lead scientist and NOAA oceanographer Phyllis Stabeno was surprised. “I did not expect to see ice this late on the shelf,” she said. In this region, ice arrives in the Bering Sea in the fall and typically melts and recedes in spring, - limiting when research vessels can be in the area.
2012 was a record breaking year. The melt season of 2012 started out at a sluggish pace. Around mid-April, sea ice extent was close to the 1979–2000 average for that time of year (the maximum ice extent typically occurring in March). However, soon after that the decline began to accelerate rapidly.
Stabeno took this as a unique and unexpected opportunity to safely sample around the ice edge. Most vessels are not made to break ice - but they can go near this melting ice region. As the ice continues to melt, the science team will resume their planned research.
This spring mooring cruise brings together scientists from NOAA’s PMEL and Alaska Fisheries Science Center, the University of Washington, US Fish and Wildlife, and the University of Alaska. While aboard the NOAA Ship Oscar Dyson, the scientists will service a biophysical mooring array. They will also collect water samples of conductivity (salinity), temperature, depth (CTD) profiles, zooplankton, ichthyoplankton, nutrients and chlorophyll samples. As well as conduct collaborative research including on harmful algal blooms, omics, and zooplankton machine learning. Results from these observations and experiments will help describe important ecosystem linkages among climate, plankton, fishes, birds and mammals.
EcoFOCI will be field testing and using several innovations this spring. Innovations and technologies such as these aim to enhance shipboard and mooring research with advanced and increased data collection. These include the deployment of a modified ‘high-latitude’, more robust surface mooring at M2 and a shallow-water glider. This is the 29th consecutive year the M2 mooring will be deployed. In 2022 a combination of the pandemic, sea ice, and a storm provided researchers a new perspective from NOAA’s longest operating biophysical mooring site in the US Arctic. Learn more about that in a NOAA Story Map (https://storymaps.arcgis.com/stories/1b413464b13c4aa381b48ecd5c89ed50).
This is the first of five NOAA EcoFOCI program research cruises planned between April and October in the Alaska region.
Learn more about mooring arrays and the EcoFOCI spring cruise on NOAA Fisheries 2022 blog.
PMEL has released “The Ocean: Earth’s CO2 Sponge,” the latest video in the PMEL at Work short video series. The PMEL at Work series highlights ongoing research activities and projects supporting NOAA’s mission to understand changes in the global ocean and its impact on climate, weather and ecosystems.
In this video, Adrienne Sutton of PMEL’s Ocean Carbon Program, and Sophie Chu, formerly of the NOAA Cooperative Institute for Climate, Ocean, and Ecosystem Studies (CICOES) at the University of Washington, highlight the exchange of carbon between the ocean and atmosphere and the ocean’s role in absorbing human carbon emissions, as well as how the ocean is impacted, and effects on marine ecosystems, climate and weather. They give a brief overview of the evolution of data collection practices—from the placement of CO2 instruments on cargo ships and research vessels starting in the 1960s, to sensors being deployed on buoys in the 1990s, to today’s innovative use of uncrewed surface vehicles (USVs). USVs have proved to be particularly effective at filling observational gaps in rough conditions, such as those of the Southern Ocean , and providing new insights into the role storms play in air-sea carbon exchange.
The Ocean Carbon Group at PMEL works to advance our scientific understanding of the ocean carbon cycle and how it is changing over time. They do so by observing the evolving state of the ocean carbon chemistry with high-quality measurements on ships and autonomous platforms, studying the processes controlling the role of the ocean in the global carbon cycle, and investigating how rising atmospheric carbon dioxide and climate change affect the chemistry of the oceans and its marine ecosystems.
Check out this new video on NOAA PMEL’s YouTube Channel and more work by PMEL scientists and engineers on the PMEL at Work playlist.
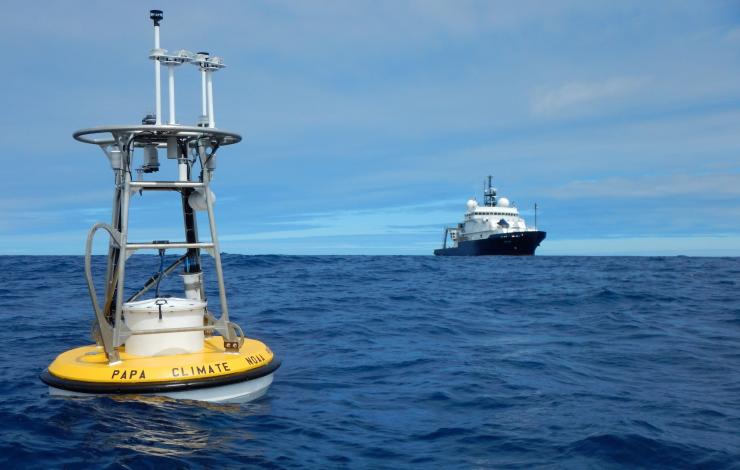
Ocean Station Papa is a long term surface mooring that monitors ocean-atmosphere interactions, carbon uptake, and ocean acidification in the Gulf of Alaska. As part of the global network of OceanSITES reference stations, measurements from the mooring are used to improve satellite products and forecast models as well our understanding of air-sea interactions, and their role within the climate system.
NOAA PMEL oceanographers and colleagues lead an effort to establish first-of-its-kind standards for calculating and reporting trends in ocean acidification observations
For the first time, an international research team compiled a set of best practices to assess and report ocean acidification trends. Standardized procedures for measuring ocean carbon chemistry are already largely established, but a common set of best practices for trend analysis are missing. These best practices will facilitate ocean acidification comparison of trends across different regions. They also allow the research community to establish enduring accurate records of change that communicate the current status of ocean acidification to the public.
Ocean acidification occurs when the ocean absorbs carbon dioxide from the atmosphere, causing a fundamental chemical change. The global rise in ocean acidity is fueled by human-emitted greenhouse gases. The global ocean has absorbed approximately 620 billion tons of carbon dioxide (~25%) from emissions released into the atmosphere by burning fossil fuels. Impacts from ocean acidification will vary by region. In order to implement adaptation and mitigation strategies, managers need an accurate and comparable understanding of how ocean acidification progresses globally, regionally and locally. This requires standardized procedures at all levels of data collection, dissemination, and analysis.
Newly published work in Frontiers in Marine Science describes these best practices developed from input from the ocean carbon science community and established best practices already adopted for atmospheric greenhouse gases. Just as NOAA’s Earth System Research Laboratories’ (ESRL) researchers played an active role in establishing standards for assessing trends in atmospheric CO2, PMEL researchers are now doing the same for ocean carbonate records.
These best practices offer a consistent analysis method people can implement on surface ocean carbon datasets to better understand ocean acidification trends and compare across regions. It will be essential to revisit, share and update these best practices as more ocean carbon measurements are available, particularly from new autonomous observing technologies.
Accompanying these best practices is free, publicly-available software for calculating trends on PMEL’s GitHub.

Dr. Meghan Cronin of NOAA’s Pacific Marine Environmental Laboratory has been named a Fellow of the American Meteorological Society. Fellows make outstanding contributions to the atmospheric or related oceanic or hydrologic sciences or their applications during a substantial period of years. New fellows account for no more than two-tenths of 1 percent of all AMS Members each year.
Dr. Cronin leads the Ocean Climate Stations (OCS) Project using autonomous platforms, including moored buoys and uncrewed surface vehicles (USV), to make meteorological and oceanic measurements to help validate numerical model and satellite products and improve our understanding of air-sea interactions and their role within the climate system. OCS has led multiple saildrone USV missions to the tropical Pacific and maintains longterm surface moorings at Station Papa in the NE Pacific and at the Kuroshio Extension Observatory (KEO) in the NW Pacific, both of which are part of the global network of OceanSITES reference stations.
With over 90 peer-reviewed publications and an h-index of 34, Dr. Cronin currently serves on several international panels and committees including the Global Climate Observing System/Global Ocean Observing System’s Ocean Observations Panel for Climate (OOPC), the second Cooperative Study of Kuroshio and its Adjacent Regions (CSK-2) steering group and OceanSITES Executive Committee and Steering Team. An affiliate professor at the University of Washington’s School of Oceanography, she particularly enjoys mentoring undergraduate summer interns, graduate students, postdoctoral fellows, and Early Career Ocean Professionals around the world.
Dr. Cronin co-chairs the Observing Air-Sea Interactions Strategy (OASIS), a UN Decade of Ocean Science for Sustainable Development programme that is developing a practical, integrated approach to observing air-sea interactions through capacity development, leveraged multi-disciplinary and international activities, and advancement of understanding. For those at AMS Annual Meeting, join Meghan at the NOAA Booth (#201) on Tuesday, January 10 at 2:45 pm Mountain Time to hear more.
Learn more about Meghan on NOAA Research’s Scientist Profiles and her research.
A typhoon, smoke from wildfires and increasing rain are not what most imagine when thinking of the Arctic. Yet these are some of the climate-driven events included in NOAA’s 2022 Arctic Report Card, which provides a detailed picture of how warming is reshaping the once reliably frozen, snow-covered region which is heating up faster than any other part of the world.
This year’s Arctic Report Card also features the most comprehensive chapter in the annual report’s 17-year history about how these dramatic environmental changes are felt by Arctic Indigenous people, and how their communities are addressing the changes. Additionally, a chapter on precipitation has been added reflecting an improvement in available data and showing the dramatic increase in precipitation across the Arctic in recent decades.
Surface Air Temperature
PMEL Arctic researcher's Dr. James Overland and Dr. Muyin Wang contributed to sections on surface air temperature. Arctic annual air temperatures from October 2021 to September 2022 were the sixth warmest dating back to 1900, continuing a decades-long trend in which Arctic air temperatures have warmed faster than the global average. The Arctic's seven warmest years since 1900 have been the last seven years.
Winter temperatures in the Eurasian Arctic and Arctic Ocean were above normal, while winter temperatures over most of North America were below-normal.
An extensive region of low pressure in the eastern Arctic supported warm Eurasian and Arctic Ocean winter temperatures, while low pressure across the Alaska Arctic and northern Canada sustained warm summer temperatures over the Beaufort Sea and Canadian Archipelago.
About the Report Card
The report card is compiled by 147 experts from 11 nations and includes three sections: Vital Signs, Indicators and Frostbites. Vital Signs provide annual updates on key topics. Indicators explore topics that are periodically updated, and Frostbites report on new and emerging issues.
View the visual highlights or recorded AGU Press Conference.
Modified from the original NOAA Press Release.