What's New Archive
Recently retired NOAA Pacific Marine Environmental Laboratory (PMEL) senior scientist Dr. Richard Feely was featured on a podcast called Ecoshock hosted by Alex Smith. The podcast addresses earth science issues like climate change and ocean acidification, and provides insights from subject matter experts.
Richard Feely is a pioneering researcher in carbon cycling and ocean acidification, and spent the past 51 years with NOAA. He is often called the "grandfather of ocean acidification" for his decades of research into how the ocean absorbs human-emitted carbon dioxide. His research established ocean acidification as a global environmental crisis.
Podcast and Audio file links:
"Meet the Evil Twin - Ocean Acidification" - Posted January 7, 2026, by Radio Ecoshock
Podcast audio only (MP3) [transcript]
Deeper dive:
Dr. Richard Feely background:
- 1974: Dr. Feely joined NOAA/PMEL after earning his PhD from Texas A&M, initially focusing on carbon cycling and the "missing" atmospheric CO2.
- 1981-1983: Initiated long-term measurements of CO2 in the ocean. Because no standards existed, his team had to develop their own precise measurement techniques.
- Mid-1980s: Published early evidence of rising CO2 and declining pH in seawater, though these findings were largely ignored by the scientific community at the time.
- 1990s: Led a massive 10-year global effort involving 99 research cruises and 72,000 samples to map carbon chemistry across the world's oceans.
- 2004: Published two breakthrough studies in Science.
- One study proved the ocean had absorbed about one-third of all human-emitted CO2 since the Industrial Revolution.
- The second study, a cross-disciplinary effort, warned that acidified water was beginning to "eat away" at the calcium carbonate shells of marine life.
- 2007: Discovered that corrosive waters off the North American Pacific coast were reaching pH levels that climate models hadn't predicted for decades.
- 2008-2009: Identified the link between changing ocean chemistry and the mass die-offs of oyster larvae in Pacific Northwest hatcheries.
- 2009: Provided critical testimony to Congress, which led to the passage of the Federal Ocean Acidification Research and Monitoring Act.
- 2010: Received the Heinz Award with a special focus on Global Change for his role in shifting public policy on ocean acidity.
- 2012: Helped establish the Global Ocean Acidification Observing Network (GOA-ON) to track acidification impacts internationally.
- 2016-2021: Led successive West Coast Ocean Acidification (WCOA) cruises, which provided the first evidence of acidification impacting the shells and sensory organs of wild Dungeness crabs.
- 2018-2020: Dr. Feely appeared on Clarivate's Highly Cited Researcher list for 3 consecutive years, in their geosciences and cross-field categories. (The Highly Cited Researcher list is an annual ranking of the top 1% of researchers cited in a year, by field.)
- 2025: Published research demonstrating that global acidification has exceeded its planetary boundary based on field data and model results.
Ocean acidification:
- PMEL Ocean Carbon Program - Ocean Acidification page
- NOAA Education - Ocean Acidification
As the 2025 hurricane season ramps up, NOAA will be testing small, uncrewed instrumented sailboats built by a robotics company to capture weather and ocean data in the path of tropical storms. The observations from these robots will help scientists understand how hurricanes do or don't intensify, which helps meteorologists provide better hurricane forecasts.
NOAA's Pacific Marine Environmental Laboratory will be playing a critical role in the mission. Its Science Data Integration Group (SDIG) receives data from NOAA-contracted Uncrewed Surface Vehicles. With support from NOAA's Global Ocean Monitoring and Observing Program, and Office of Marine and Aviation Operations, SDIG invented and custom-built automated processes that receive data, assess data integrity, and distribute data within minutes on the World Meteorological Organization's (WMO's) Global Telecommunications System (GTS) for use by NOAA and global operational weather forecast centers.
That's just one of the key services developed by PMEL's SDIG. This group is the foundation of PMEL's data management capacity, responsible for the comprehensive management, processing, curation, and dissemination of a vast array of environmental data. Data from ocean and atmospheric measurements are a strategic asset that underpins all of NOAA's products and services, guiding everything from daily weather forecasts to climate predictions and ecosystem management.
The C-Star is a four-foot long, wind- and solar-powered instrumented uncrewed surface vessel built by the British company Oshen. Light and cost effective, the C-Stars transmit data from sensors that measure wind speed and direction, sea surface temperature, air temperature, air pressure and relative humidity. A fleet of five C-Stars will join satellites, Hurricane Hunters and a diverse array of uncrewed airborne and marine systems in gathering vast quantities of data about oceanic and atmospheric conditions to feed into weather models that will help improve hurricane research and forecasting.
SDIG's job is to ensure the integrity, accessibility and long-term stewardship of taxpayer-funded scientific data collected by NOAA researchers. That starts by collaborating with scientific teams to receive unprocessed data from various observational platforms, including moorings, drifting buoys, autonomous surface and underwater vehicles, and research vessels.
Next, data must be processed and assessed for accuracy. Metadata records—information about the data, such as what type of sensor was used to collect it—is essential for the data's retrieval, analysis and preservation, and must be created and maintained. The data are made available to the scientific community, policymakers and the public, via web portals, software interfaces, and in many cases working with users directly to ensure easy access and effective use of the data.
Data are also archived in trusted national and international repositories, like NOAA's National Centers for Environmental Information.
Data from roboting observing platforms, such as C-Star, are received through communication pathways that differ from the normal 1,140 data sets PMEL receives every day via satellite. In 2024, PMEL systems processed more than 26 thousand discrete data deliveries with more than 2 million data records. Each data record contains between 20 and 35 measurements that are verified and distributed to research and operational end users who use the data to provide valuable forecasts and research results to benefit the public.
"All this adds up to petabytes of data—that’s millions of gigabytes," said PMEL director Michelle McClure. "Ensuring that these data are not only high quality, but also easy to use is a tremendous service that PMEL's data managers play that most take for granted."
On Tuesday, July 29th, 2025, an 8.8 magnitude earthquake occurred off the Kamchatka Peninsula in Russia, triggering numerous tsunami alerts in Alaska, Hawaii, the U.S. west coast, and throughout the Pacific. At the NOAA Pacific Marine Environmental Laboratory (PMEL), a team of researchers in the NOAA Center for Tsunami Research (NCTR) work to improve tsunami warnings and preparedness by enhancing measurement technology, optimizing monitoring networks, improving the accuracy of forecast models, and improving the prediction of coastal impacts. Continue reading to learn about this critical research that keeps citizens safe from tsunami threats.
Constant monitoring: Collecting real-time data
The Deep-ocean Assessment and Reporting of Tsunamis (DART) is a real-time tsunami monitoring system, developed by PMEL, that is positioned at strategic locations throughout the ocean to play a critical role in tsunami forecasting. DART systems are some of the first data collection points, sending real-time information to NOAA Tsunami Warning Centers. DART systems use underwater sensors and surface buoys to observe unusual wave activity and sea surface levels that could indicate a tsunami. When the sensors detect these sea level anomalies, the system sends real-time data via satellite to warning centers. This information then helps scientists update forecasts that can be used to update and scale watches, warnings, or advisories that protect people in vulnerable areas.
Looking ahead: Preparing inundation maps
Scientists test how tsunamis form, move across the ocean, and flood coastal areas by inputting detailed maps of the shape of the land and seafloor into computer models. These models can then be used to see how far a tsunami will travel and what the water depth will be in flooded areas. Detailed maps of future tsunami flooding (inundation) are critical for planning the best options for evacuation routes in vulnerable coastal communities. This mapping supports NOAA’s TsunamiReady® Program and the UNESCO-IOC’s Tsunami Ready Recognition Programme (TRRP) that empower communities to be prepared and resilient to tsunamis. NCTR scientists create inundation maps by utilizing the Method of Splitting Tsunami (MOST) model to simulate tsunami generation, ocean propagation, and detailed flooding over land.
Ready when it happens: Producing a tsunami forecast
Timely and accurate tsunami forecasts are crucial for local officials to support tsunami evacuations. NOAA is improving tsunami forecasting using a system called Short-term Inundation Forecasting for Tsunamis (SIFT). This system uses a library of pre-computed scenarios based on likely undersea earthquakes. When an earthquake happens, SIFT quickly combines these pre-computed scenarios with actual ocean observations provided by the real-time data from DART sensors. Warning center scientists use this information to produce timely forecasts of tsunami arrival times, wave heights, and inundation areas. As more data become available, SIFT automatically updates forecasts for warning center scientists to keep coastal communities informed.
To learn more about the ways NOAA researches and forecasts tsunamis, visit the links below:
- Science Behind Tsunamis
- Tsunami Safety
- Current tsunami warning, advisories, watches, or threats
- NOAA PMEL’s tsunami video playlist on YouTube
Did you know that wave anomalies detected by DART systems can last for days after a tsunami event? Imagine you drop a rock in a bathtub. The initial ripples or "waves" caused by the rock dropping into the water will travel across the tub and then bounce back off the walls. When a tsunami occurs, initial waves ripple across the ocean and then can bounce back when they hit land. An example of this was during the 2004 Japan tsunami event, when sea level anomalies continued for two days after the initial tsunami warnings were released and reflections were detected that crossed the ocean basin. Keep in mind that strong currents dangerous to swimmers and boats can continue even after a tsunami alert is cancelled.
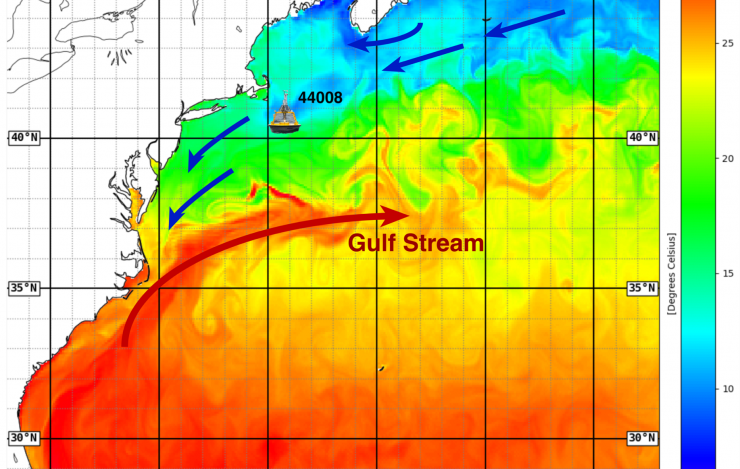
Approximate location of the enhanced NDBC 44008 weather buoy shown overlaid on an analysis of sea surface temperature in degree Celsius for 17 June 2025 from the NOAA Global RTOFS high resolution ocean model. The blue arrows indicate the return surface flow north of the Gulf Stream, with the larger red arrow depicting the Gulf Stream. Image Credit: NOAA Ocean Prediction Center, modified by Y. Serra to show buoy and current arrows.
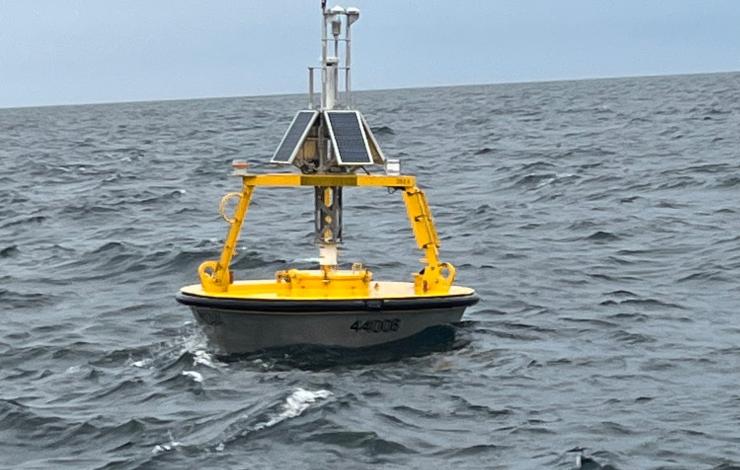
Enhanced weather buoy 44008 deployed on 9 May 2025 at 40.50°N 69.25°W. Photo courtesy of James Elliott, NDBC.
On May 9, 2025, a research-enhanced weather buoy was deployed at 40.50°N 69.25°W for an expected observing period of one year. Working alongside a team of engineers and technicians at the National Data Buoy Center (NDBC), Dr. Yolande Serra's (UW/CICOES) project has enhanced weather buoy 44008 with additional surface and subsurface sensors. The station, located on the New England shelf on the north side of the core Gulf Stream current in 72 meters of water, has standard measurements of wave height and period, sea surface temperature, wind speed and direction, air temperature, humidity, and surface pressure available from all NDBC operational weather buoys. This project's enhancements include a current meter at 3 meter depth, subsurface temperature, salinity, and pressure sensors distributed at depths from 5 to 55 meters, an upward looking acoustic doppler current profiler at 55 meter depth, and upward looking solar and infrared radiometers mounted on the buoy tower.
With the addition of the radiation sensors, the weather buoy now provides all the components of the surface ocean heat budget, while the subsurface temperature and salinity sensors provide information about the heat content and depth of the surface mixed layer. We can additionally learn about ocean mixing and advection of heat and water properties from the wind, wave, and current measurements. Together, the added observing capabilities provided through this pilot study could lead to better understanding and prediction of the ocean's influence on storm development impacting the northeastern US, as well as marine heatwaves, coastal circulation, and ocean eddies.
While the operational data are distributed through NDBC’s standard webpage, "enhancement" data are pulled to PMEL servers and served via a NOAA/PMEL public data access portal. This project is located about 65 nautical miles east of the US National Science Foundation Ocean Observatories Initiative (OOI) Coastal Pioneer New England Shelf Array, a 5-year research program that collected detailed ocean and air-sea interface observations of the New England shelf from 2017 to 2022, providing important context for our 1-year pilot study. The data collected by our project are aligned with the data needs of the National Weather Service (NWS), Northeastern Regional Association of Coastal Ocean Observing Systems (NERACOOS), and Mid-Atlantic Regional Association Coastal Ocean Observing System (MARACOOS), with additional potential data users within the fishing and wind energy communities. The future of the enhanced weather buoy concept will be explored through surveys of our primary data users following the outcome of this pilot study and the ongoing needs of the US coastal communities.
The "Pilot Upgrade of NOAA NDBC Coastal Weather Buoys for Improved Monitoring of Weather and Climate", led by Dr. Yolande Serra (UW/CICOES) as a joint UW/CICOES, NOAA/NWS/NDBC, and NOAA/PMEL project, was funded by NOAA's Weather Program Office (WPO) grant number NA23OAR4590404. This project is in alignment with the Weather Forecasting and Innovation Act of 2017 (Public Law 115-25), which aims to improve NOAA's weather research through "investment on affordable and attainable advances in observational, computing, and modeling capabilities".
PI, Co-PIs and Project Affiliates:
Yolande Serra - UW/CICOES
Meghan Cronin - NOAA/PMEL
Dongxiao Zhang - NOAA/PMEL and UW/CICOES
Ian Sears - NOAA/NDBC
James Elliott - NOAA/NDBC
Nathan Anderson - NOAA/PMEL and UW/CICOES
Patrick Berk - NOAA/PMEL and UW/CICOES
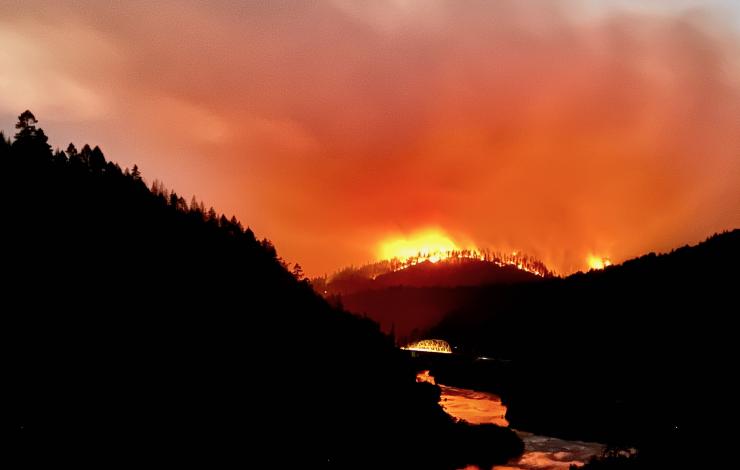
The Rum Creek fire burns vigorously after sunset near Merlin, Oregon on August 28, 2022. Credit: Robert Hiatt, NOAA National Weather Service
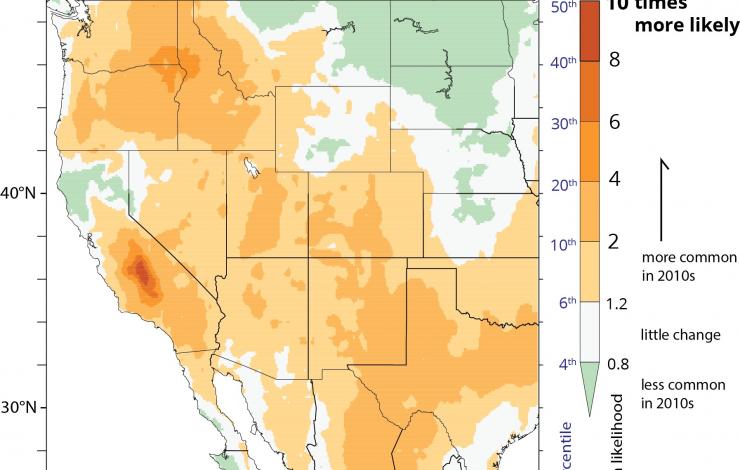
This graph shows how the frequency of nights with dry fuels predisposed to burning has increased between the 1981-2000 period and the 2011-2020 period. This has created the conditions for increased fire activity at night, a time when firefighters could once count on falling temperatures and rising humidity to give them a break. Credit: Pacific Marine Environmental Laboratory.
For decades, firefighting crews counted on falling temperatures and rising humidity at night to dampen wildfire activity, allowing them to rest, regroup and prepare for the next day.
Over the last 20 years though, satellite measurements have confirmed a change reported in the western US by firefighters on the ground: a dramatic increase in nighttime fire activity by larger fires. Previous studies attributed the increase to warmer, drier nights, conditions that help to maintain the flammability of fuels.
New research from NOAA, the University of Washington and the U.S. Forest Service has investigated other weather conditions that influence fire behavior, the extent to which these factors have been changing over recent decades and how they may have contributed to changes in nighttime fire behavior.
"We looked for simultaneous changes in winds, atmospheric mixing and fuel moisture that might enhance nocturnal fire activity," said lead author Andy Chiodi, a University of Washington scientist working with NOAA’s Pacific Marine Environmental Laboratory. "Our results show that, indeed, all the atmospheric measures that influence wildfires have changed towards supporting more intense nocturnal fire behavior."
The findings were published in the Journal of Climate.
The implication of these findings, said Chiodi, is that researchers need to better understand the interplay of each of these factors in driving increases in nocturnal fire activity, which not only complicate firefighters’ jobs, but also could jeopardize public safety.
In 2022, a study led by the US Forest Service confirmed that the amount of fire radiative power, or the amount of heat generated by burning, detected at night over the contiguous U.S. by two NASA satellites (VIIRS and MODIS) increased by approximately 50 percent during the 2003-2020 study period. That study found the change was most pronounced for the larger fires burning in drier heavy fuels that experienced more active nighttime burning.
The current study expands on Chiodi’s previous work that examined changes in night time vapor pressure deficit, which determines the rate at which woody fuels lose moisture to the air, over the western U.S. during the last 40 years. As fuels dry they become more susceptible to burning. The study found over that period that the number of dry-air nights had indeed increased.
The new paper explored not only the frequency of dry nights but also how often they were accompanied by other weather factors conducive to burning. "It’s important to know how each of these has changed to accurately interpret changes in nighttime fire behavior," Chiodi said.
Chiodi explained that typically, when the sun sets, reduced solar heating cools the surface, calms winds and turbulence, and allows for the formation of a stable layer at the surface, called the planetary boundary layer, which acts as a kind of cap. Reduced wind speeds tend to moderate fire activity. Cooler air below a lower, stable boundary layer traps humidity and smoke, which can further subdue fire behavior.
The new study found that in the 2010s, dry-fuel nights were not only more than 10 times more frequent compared to the 1980s and 1990s in some locations, fire risk was compounded by simultaneously windier and deeper boundary layers, over 81% of the Western U.S.
"So the problem is that it’s not just drying out, it’s that places that are getting drier are seeing a double or triple whammy: drier nights, more wind and a deeper atmospheric boundary layer."
The study found southern California, especially the western slopes of the Sierra Nevada, are hot-spots for this trend. This region was already quite dry in terms of fuel moisture in the 1980s and 1990s. More recently, it has experienced some of the greatest increases in frequencies of dry and windy nights.
These insights not only have value for operational firefighting decisions, Chiodi said they can also help inform decisions about when conditions are appropriate for prescribed burns, which are critical for mitigating wildfire risk, especially near developed areas.
Chiodi is presently working with Forest Service colleagues to build user-friendly tools that can quickly identify safe weather windows for effective prescribed burns.
Despite rapid Arctic warming, plan for more frigid spells
New research on the Arctic confirms that even as the Arctic is warming faster than the rest of the world, cold-air outbreaks from the polar region will continue across the Northern Hemisphere in the coming decades.
The big challenge now is to better understand what triggers these cold-air outbreak events and how to improve their predictability.
Much of the previous research has shown how a weakening of the stratospheric polar vortex can allow pockets of frigid air to plunge much farther south than normal. The new study, conducted by an international team including Arctic researchers from NOAA, provides additional insights as to how other influences - stalled weather systems, stretching of the stratospheric polar vortex and even events in the distant midlatitudes can influence these polar patterns.
"A better understanding of these Arctic-midlatitude linkages would improve forecasts covering periods of weeks to months, which would give communities more time to plan for adverse winter weather conditions," said co-author Muyin Wang, a scientist from the Cooperative Institute for Climate, Ocean, and Ecosystem Studies who works at NOAA’s Pacific Marine Environmental Laboratory (PMEL). "The impacts can be more significant as societies conditioned to global warming become increasingly less used to them."
The study was published in Environmental Research: Climate.
The stratospheric polar vortex is a mass of cold whirling air bounded by the jet stream that forms 10 to 30 miles above the Arctic surface in response to the large north-south temperature difference that develops during winter. Generally, the stronger the winds, the more the air inside is isolated from lower latitudes, and the colder it gets. But sometimes it can be shifted or stretched off the pole toward the United States, Europe or Asia.
"It seems really counterintuitive, but there will be plenty of ice, snow, and frigid air in the Arctic winter for decades to come, and that cold can be displaced southward into heavily populated regions by Arctic heat waves," said co-author Jennifer Francis with the Woodwell Climate Research Center.
The study, which resulted from an international workshop held in 2023 in Great Britain, provides a new analysis of recent research that offers a pathway to improved forecasts.
The authors said the stratospheric polar vortex has been relatively under-studied in previous reviews of Arctic-midlatitude climate linkages that focus predominantly on the role of changes in the tropospheric polar jet stream. They suggest that future research should focus on the complicated interactions between Arctic, midlatitude and tropical influences.
While many analyses focus on warm Arctic and cold midlatitude events, connections have also been found between unusually cold Arctic temperatures and warm winter events in midlatitudes, especially in Europe.
"Such a range of results confounds those who would like the science to offer a simple way to anticipate seasonal outlooks," said James Overland, a research oceanographer at PMEL.
One of the complicating factors occurs when a weather system stalls, creating an atmospheric block: a quasi-stationary modification of the jet-stream flow that occurs at middle and high latitudes and typically last for one to a few weeks. Blocking events are associated with persistent weather conditions in the vicinity of the block and frequently lead to extreme weather events in midlatitudes, including winter cold air outbreaks.
Tropical climatic drivers, such as the El Niño-Southern Oscillation and the Madden-Julian Oscillation, can create the conditions that lead to the establishment of these atmospheric blocks thousands of miles away.
The study authors underscored the need for research to better understand how to predict cold outbreaks in lower latitudes, which will help communities adapt to the consequences of extreme cold weather.
"The Arctic may seem irrelevant and far away to most folks, but our findings show that the profound changes there affect billions of people around the Northern Hemisphere," said lead author Edward Hanna with the University of Lincoln.
The international research team was composed of scientists from the United States, United Kingdom, Germany, Finland, South Korea, China and Japan.
"The most interesting part of the research is that the polar vortex stretching events could be an important driver of North American cold air outbreaks,” said Amy Butler, a climate researcher with the Chemical Sciences Laboratory who was not involved in the study. “It’s a novel way of looking at how the stratosphere might influence the surface climate - It’s certainly worth understanding better to improve predictability."
(Material from University of Lincoln and Woodwell Institute press releases were included in this story.)
Hanna, E., J. Francis, M. Wang, J.E. Overland, J. Cohen, D. Luo, T. Vihma, Q. Fu, R.J. Hall, R. Jaiser, S.-J. Kim, R. Köhler, L. Luu, X. Shen, I. Erner, J. Ukita, Y. Yao, K. Ye, H. Choi, and N. Skific (2024): Influence of high-latitude blocking and the northern stratospheric polar vortex on cold-air outbreaks under Arctic amplification of global warming. Environ. Res. Clim., 3(4), 042004, doi: 10.1088/2752-5295/ad93f3

Sea lion pups were just one of the many types of wildlife to suffer when a large marine heatwave that became known as "The Blob" took hold in the Pacific Ocean off the West Coast. Credit: NMFS
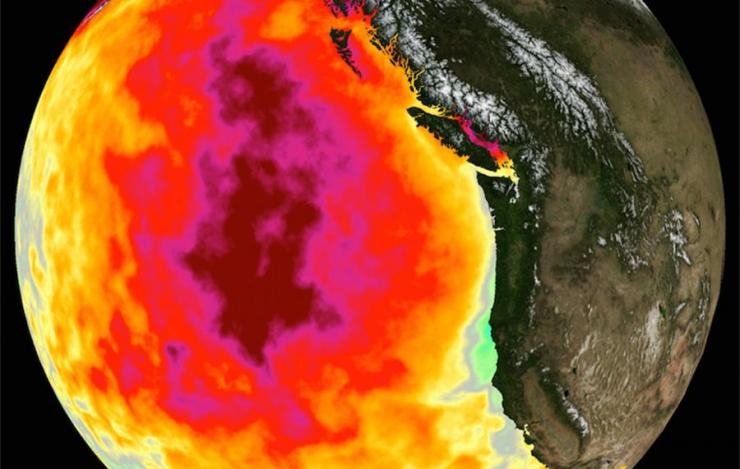
This data image shows the monthly average sea surface temperature for May 2015, the peak of the marine heat wave dubbed The Blob. Credit: NASA Physical Oceanography Distributed Active Archive Center
The North Pacific has warmed significantly faster than any other ocean basin on Earth since 2013, enduring two major marine heat waves in five years that had devastating effects on marine mammals, seabirds, as well as fisheries and the communities that rely on them.
Oceanographers are asking "What’s going on in the North Pacific?"
"How long will sea surface temperatures continue to increase at the rate they have?" asked Michael McPhaden, senior scientist at NOAA's Pacific Marine Environmental Laboratory. "And what will the consequences be? Understanding the underlying physical processes better and developing ways to skillfully forecast the future evolution of this trend are really important."
In a new paper published in Nature Climate Change, McPhaden and a team of researchers from NOAA's Climate Prediction Center and National Centers for Environmental Information describe one of the processes driving the North Pacific's trajectory into uncharted waters.
Rising greenhouse gas concentrations in the atmosphere, they said, are driving more heat into the ocean's surface layer. This creates a greater temperature differential with deeper water and less turbulent mixing with colder water at depth, which causes the surface mixed layer to become thinner. Heat entering the ocean becomes trapped in this shallower layer, which further accelerates surface warming.
This dynamic also creates a negative feedback, albeit not nearly enough to counter the warming trend. Warmer surface water evaporates more quickly, transferring heat back to the atmosphere and reducing the rate at which sea surface temperatures would otherwise rise.
The increase in global ocean temperature during the last few decades has been well documented. Sea surface temperatures increased during the 20th century and continue to rise. Sea surface temperature has been consistently higher during the past three decades than at any other time since reliable observations began in 1880. The year 2023 was the warmest ever recorded.
Record high sea surface temperatures in 2023 were accompanied by marine heatwaves around the globe, including in much of the North Atlantic Ocean, parts of the Mediterranean Sea, Gulf of Mexico and the Caribbean Sea, Indian Ocean and North Pacific Ocean.
McPhaden noted that previous research has demonstrated that in most parts of the global ocean, the surface mixed layer is getting thinner due to global warming. "We can see evidence of this in other basins," he said. "so there must be something else going on to distinguish the North Pacific."
How much of this accelerated warming results from processes internal to the North Pacific as opposed to remote forcing from higher or lower latitudes, or from other ocean basins, is an open question, he said.
"Whatever the ultimate causes, this temperature rise can’t continue forever at the current rate," said McPhaden. "What will the North Pacific look like 10-20 years from now? The rate of warming may slow down or plateau, but in either case we will need an improved decadal forecast system to help us prepare for that future."
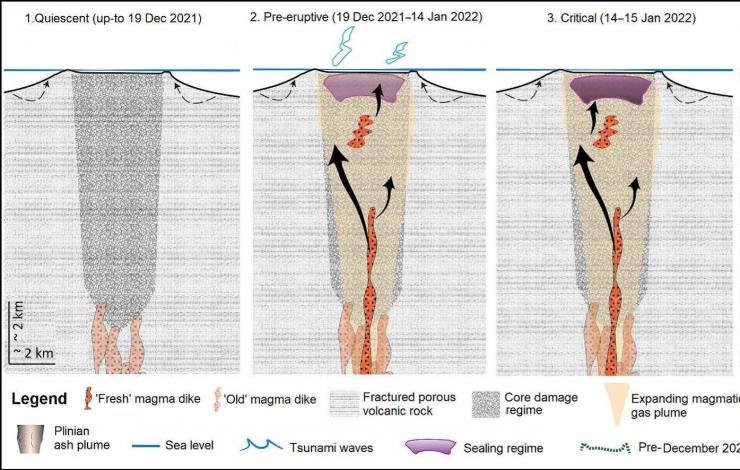
The extraordinarily powerful eruption of Hunga volcano in the Tongan archipelago in the southern Pacific Ocean on January 15, 2022 blasted gas and ash 36 miles high, generating atmospheric gravity waves, two different types of destructive tsunamis, and the loudest atmospheric explosion recorded by modern instrumentation. It was one of the largest eruptions of the past 300 years.
Initially, scientists suggested the explosion occurred when magma reacted violently with water that had infiltrated the caldera of the submarine volcano, or perhaps by the collapse of the caldera itself.
Now a team of international scientists have proposed an alternative trigger mechanism, saying the trigger was the accumulation of mineral deposits within the volcano closing off exit pathways for gases from magma to escape, leading to the buildup and catastrophic release of pressure strong enough to generate shock waves that circled the planet. This theory is consistent with various lines of evidence.
Their findings are detailed in a paper that has been accepted for publication in the Journal of Volcanology and Geothermal Research.
"There are many submarine volcanoes within US territorial waters that have the potential for hazardous explosive eruptions," said Sharon Walker, an oceanographer at the NOAA's Pacific Marine Environmental Laboratory and a study co-author. "It is very important to understand all the ways that volcanoes can generate tsunamis, and to incorporate these factors into prediction and modelling capabilities so coastal communities can be prepared and resilient."
The Hunga volcano generated both extreme runup tsunamis and quite unusual and destructive meteotsunamis. The waves devastated Tonga islands locally, affected coastlines around the Pacific and were recorded around the globe, said PMEL tsunami researcher Vasily Titov. The explosive displacement of water within the caldera was one tsunami-generating mechanism. The explosion-induced pressure wave produced another kind of tsunami, often called a meteotsunami.
"There may have been other mechanisms involved as well, like landslides and pyroclastic flows off the caldera, for example,” he said. “Analysis of the tsunami data helps us better model the tsunami propagation. This new understanding will aid the development of tsunami forecast capabilities for similar events in the future."
The researchers said their new theory also accounts for the eruption's magnitude, the time sequence of the event, the massive amounts of volcanic gas that were released, the remaining volcano structure and the presence of minerals formed by gas from magma interactions with the surrounding rock (e.g., sulphate minerals) in the ash deposits.
For a submarine volcano to release enough energy through the water column to create this immense plume as well as a globally-felt atmospheric air blast and a meteotsunami, a colossal amount of force would be required, similar or even larger than that of the 1883 Krakatoa eruption.
Co-author Cornel de Ronde, a researcher with GNS Science in New Zealand, said that understanding the cause of the eruption is important for volcano monitoring and risk preparedness, not just for the Tongan archipelago but for submarine volcanoes generally.
"The eruption at Hunga has opened our eyes," de Ronde said.
The research team will be returning to the Tongan archipelago this month onboard the New Zealand Research Vessel Tangaroa to collect geological, geophysical, and water column data in and around the Hunga volcano crater to further investigate the cause of the eruption.
This story was adapted from a release issued by GNS Science.
January 15, 2022 Tonga volcano-generated tsunami propagation (YouTube)

This diagram depicts the key aerosol, cloud, dynamics, and radiation processes in the marine boundary layer (left) and the MCB approach using ship-based generators to produce fine sea-salt aerosol droplets (right). The droplets are lofted into clouds by updrafts, where they increase droplet concentrations, extending the reflectivity coverage and lifetime of the clouds. Credit: After Sorooshian et al. 2019.
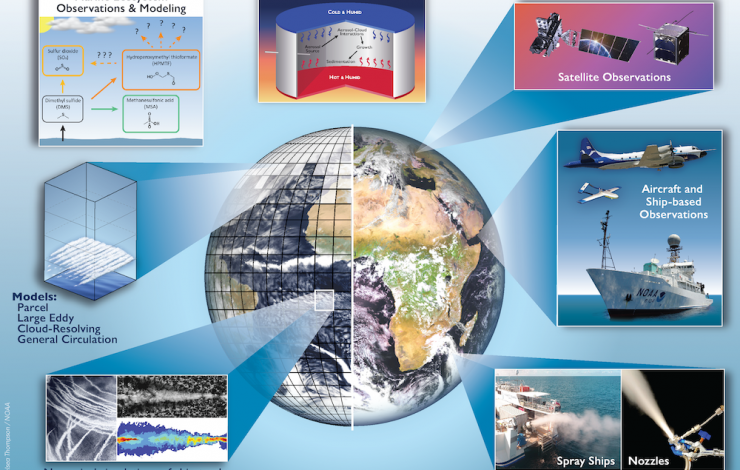
An integrated approach to a MCB research program comprising laboratory facilities, field experiments, and modeling is depicted. Earth view image is courtesy of the European 336 Organisation for the Exploitation of Meteorological Satellites (EUMETSAT), with modifications to highlight ship tracks and model mesh. Credit: Chelsea Thompson/NOAA
As the levels of greenhouse gases in the atmosphere continue to increase and climate change impacts become more costly, the scientific community is redoubling efforts to investigate the potential risks and benefits of artificially shading Earth’s surface to slow global warming.
Marine cloud brightening (MCB) proposals involve the injection of salt spray into shallow marine clouds to brighten them, increasing their reflection of sunlight and reducing the amount of heat absorbed by the water below.
A group of 31 leading atmospheric scientists, among them PMEL atmospheric chemist Patricia Quinn, have offered a consensus physical science research roadmap to build the knowledge base needed to evaluate the viability of MCB approaches. Their roadmap is described in a new paper published in the journal Science Advances.
"Interest in MCB is growing, but policymakers currently don’t have the information they need to reach decisions about if and when MCB should be deployed,” said lead author Graham Feingold, a researcher with NOAA’s Chemical Sciences Laboratory. “The question is whether we can design a MCB research program using our current modeling and observational tools to establish the feasibility of this approach on a global scale, and if not, what needs to be done to position ourselves to do so."
Co-author Lynn Russell, a climate scientist at the Scripps Institution of Oceanography at the University of California San Diego added that a research plan is essential before considering whether to adopt MCB. "We need to simultaneously address the physical science questions and the human dimensions," Russell said.
Current MCB proposals rely on saltwater spray, which would mimic plumes of sulfur-rich emissions from ship stacks or volcanoes, to increase the aerosol concentration in the lower marine atmosphere. Ideally, droplets in the saltwater spray evaporate to produce fine particles that are carried up to the cloud layer by turbulent and convective air motions. The study proposes a substantial and targeted program of MCB research that includes laboratory studies, field experiments, and cloud modeling, along with new laboratory facilities to address aerosol and cloud microphysical processes.
In practical terms, researchers need to develop sufficient confidence that appropriately sized particles can be generated and delivered to the clouds, and act to form cloud droplets that efficiently scatter sunlight. They would need to show that clouds could be brightened consistently and over a large enough area to meaningfully cool the ocean below. Scientists would further need to show that the brightening of the clouds would be measurable to demonstrate it would work as intended at globally relevant scales, or in sensitive regional ecosystems, such as coral reefs.
"We would have to get the right-sized particles into receptive clouds at the right times of day and seasons, and over large-enough areas to shade large areas of ocean," said Feingold. "It’s a major challenge."
Feingold emphasized that MCB would not replace decarbonization and would not alleviate ocean acidification. "To reduce global temperatures, our highest priority should be to remove carbon dioxide from the atmosphere. MCB might help to alleviate the worst impacts of climate change."
For more information, contact Theo Stein, NOAA Communications: theo.stein@noaa.gov.
A copy of the paper may requested from Science Advances, at: https://www.science.org/journal/sciadv
This story was adapted from an article posted on NOAA Research.
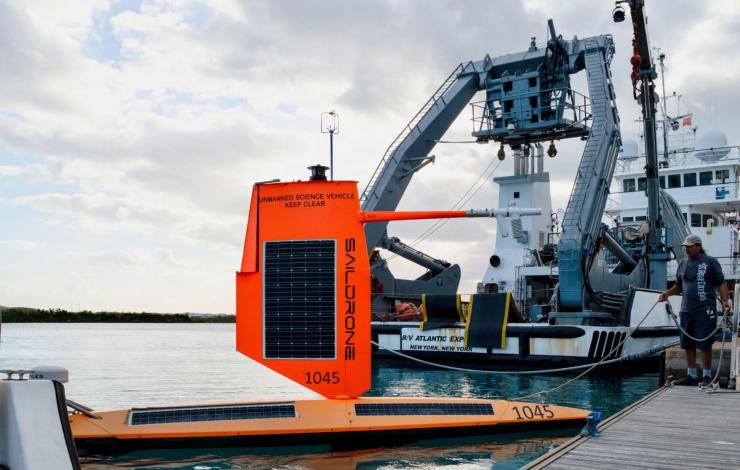
Saildrone 1045 docks in Bermuda after its historic mission into the eye of a Category 4 hurricane in 2021. Credit: Saildrone Inc. / Ali Hochberg/Bermuda Institute of Ocean Sciences
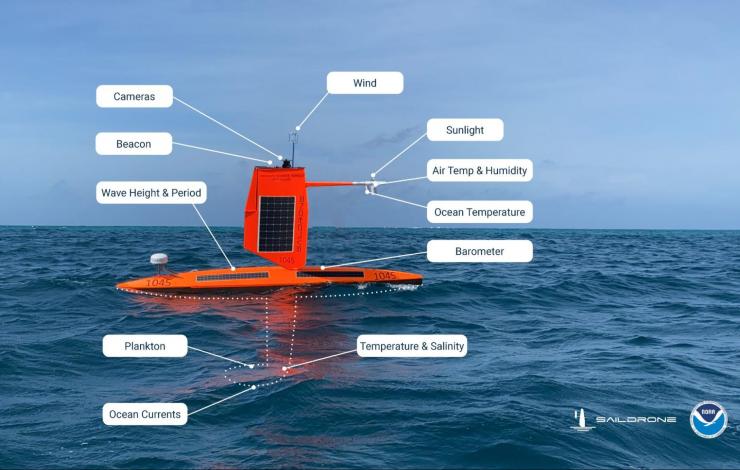
This photo illustration summarizes oceanographic and atmospheric sensors, along with cameras and navigational instruments carried by the Saildrone Explorers during the 2021 Atlantic Hurricane mission. Credit: Saildrone Inc.
Hurricane intensity predictions would benefit from timely, more accurate ocean temperature, salinity and wave measurements, NOAA researchers find.
On September 30, 2021, a saildrone uncrewed surface vehicle made history by intercepting the eyewall of Hurricane Sam in the northwestern tropical Atlantic, recording a viral video of what it’s like to be tossed around by 100 mile-per-hour winds and 30-foot high waves.
The Guinness Book of World Records later certified that a 126.4 mile-per-hour wind gust recorded by the bright orange 23-foot saildrone in the core of the Category 4 storm was a new world record for an uncrewed surface vehicle.
But the most long-lasting impact of Saildrone Explorer SD 1045’s trailblazing research voyage may come from the continuous readings collected by the craft’s temperature sensors. Timely, accurate upper-ocean observations like those collected during the mission could directly benefit hurricane intensity forecasts - if they can be swiftly provided to weather forecast systems, according to new research by NOAA oceanographers published in Frontiers of Marine Science.
“Sam turned out to be one of the longest and strongest hurricanes in our historical record,” said Andrew Chiodi, an oceanographer with NOAA’s Pacific Marine Environmental Laboratory (PMEL). “We were targeting the northeast eyewall and the intercept was a bulls-eye. Until now, we haven’t had a surface platform that we can steer into a hurricane while it continuously measures air-sea interactions, and transmits data in near real-time for use by numerical hurricane forecast models.”
Early and accurate forecasts of storm tracks and intensity are vital for protecting life and property from hurricane impacts. During the past decade, however, the accuracy of hurricane track predictions has substantially outpaced those for storm intensity, which is influenced by transfers of heat and momentum across the ocean surface during tropical cyclone development. Sea surface temperature has long been used as a statistical predictor of intensity.
Analysis by Chiodi and his research team found that the observations and measurements collected by the ocean robot revealed surface ocean temperatures had unexpectedly risen during the first half of the storm. These changes were not captured by satellites, profiling floats, or hurricane-hunting aircraft that provide the data used by hurricane forecast models, said co-author Greg Foltz, a NOAA oceanographer with the Atlantic Oceanic and Meteorological Laboratory.
As a result, the forecast model predicted surface waters to be cooler than they actually were. This caused the model to underestimate the flow of heat from the ocean into the storm near the eyewall, which reduced the forecasted potential intensity of the storm.
Hardy, adaptable, and cost-effective
Enter the saildrone. Remotely piloted and powered by wind and solar energy, these rugged ocean robots can make multiple simultaneous environmental observations including wind speed, wave height, temperature, pressure and salinity in places too dangerous for people to venture. Saildrones are equipped with Global Positioning System and an onboard computer, enabling the vehicles to navigate to prescribed waypoints, autonomously adjusting for wind direction and current. Each vehicle is supervised 24/7 by operators at Saildrone Mission Control in Alameda, California.
PMEL began a partnership with Saildrone, Inc. in 2014 to adapt the uncrewed surface vehicles to collect high-quality oceanic and atmospheric observations.
In addition to the vehicles themselves, Saildrone, Inc. provides engineering expertise in vehicle design, software, electronics and operations. PMEL provides engineering expertise on sensors, sensor sampling schemes, telemetry protocols and access to calibration equipment and facilities.
NOAA-Saildrone missions have included surveys of the U.S. west coastal waters around Alaska, basin-scale crossings from Hawaii to San Diego and San Francisco to the Equatorial Pacific, and high-latitude missions in the Bering and Chukchi Seas, with tasks ranging from tracking fish and mammals, measuring dissolved carbon dioxide, salinity, and ocean acidification, detecting and tracking oil seeps and spills, charting underwater bathymetry for safe navigation, and surveying the Arctic ice edge.
In 2019, a modified saildrone completed a 196-day, 13,500-nautical-mile journey around Antarctica, collecting oceanic and atmospheric carbon dioxide measurements with a PMEL-designed instrument in one of the most hostile seas on the planet - in winter. “The assumption was the Southern Ocean would eat the saildrone,” said PMEL’s Adrienne Sutton. “And that would be that.”
During the 2021 Atlantic hurricane season, five saildrones were deployed in selected areas of the northwestern tropical Atlantic, Caribbean, and South Atlantic Bight, their wings strengthened and reduced in height to withstand hurricanes. Saildrone SD-1045 navigated into position northeast of Puerto Rico so it could intercept Hurricane Sam on the northeast side, where winds are usually most intense. Sam was the 2021 Atlantic hurricane season’s strongest and longest-lived storm and one of the longer-lived Atlantic hurricanes since basinwide satellite monitoring began in 1966.
“The saildrone allows us to monitor conditions continuously throughout the core of a storm, where most of the energy exchange occurs,” Foltz said. “This is a good example of the unique value of the saildrone measurements for research, and potentially for improving hurricane intensity forecasts.”
Since 2021, NOAA has continued to partner with Saildrone to improve hurricane forecasts. In 2023 NOAA increased the number of saildrones tracking hurricanes from seven to 12, with data made available to the next-generation Hurricane Analysis and Forecast System.
Researchers are now using data collected by saildrones and other in-situ and remote-sensing platforms for use in improving the new forecast system. They’re also exploring adding new sensors to future saildrone missions to capture unique measurements like sea spray, which influences heat and momentum exchanges within hurricanes.
In addition to NOAA scientists, coauthors on the paper included researchers from the University of Washington, University of Hawaii, University of Miami, University of Georgia, the U.S. Naval Research Laboratory, Penn State University and the University of Santiago de Compostela in Spain.


