Related Stories

The PMEL carbon group is developing a network of carbon dioxide systems on coastal moorings. ...

Scientists find rising carbon dioxide and ‘acidified’ waters in Puget Sound ...

The PMEL carbon group is developing a network of carbon dioxide systems on coastal moorings. ...

The PMEL carbon group is developing a network of carbon dioxide systems on deep water moorings. ...


A MAPCO2 system is located on the NDBC Mooring off Cape Elizabeth Washington (47.35°N 124.73°W). ...
La Push
NANOOS UW Mooring, Ćháʔba·, off of La Push, WA (47.97°N, 124.95°W)
The Applied Physics Laboratory of the University of Washington (APL-UW) and the Northwest Association of Networked Ocean Observing Systems (NANOOS) launched an ocean observing array off the outer coast of Washington near La Push in July 2010. The Quileute Tribe held a contest to name the buoy, and the chosen name Ćháʔba·, pronounced "chay buh," means "whale tail."
Award funds from the Murdock Charitable Trust to the University of Washington and matching funds from the UW Applied Physics Laboratory, College of the Environment, and the Provost’s Office enabled construction of a moored buoy system, with sensors to monitor ocean and weather conditions. A Seaglider, an autonomous underwater vehicle, is also part of the observing array and will run tracks near the buoy, extending our knowledge of ocean conditions through space and time. These observing assets will be part of the ocean observing system that NOAA funds, via NANOOS, as part of the U.S. Integrated Ocean Observing System (IOOS). The data from these assets can be viewed in real-time from the NANOOS website. This project is also supported by NOAA's Ocean Acidification Program.
The PMEL carbon group is collaborating with the UW researchers to make carbon measurements at the site. A MAPCO2TM system and a surface seawater pH sensor were deployed on the buoy on July 16, 2010. By measuring pH in addition to pCO2, we are able to more accurately and precisely study the changes associated with ocean acidification. All seawater pH observations are shown in the second figure below.
Data availability: archived at NCEI.
Plots of surface water and atmospheric CO2 and surface water pH (click+drag to zoom):
Monthly climatology of surface seawater aragonite saturation state (Ω) and pH:
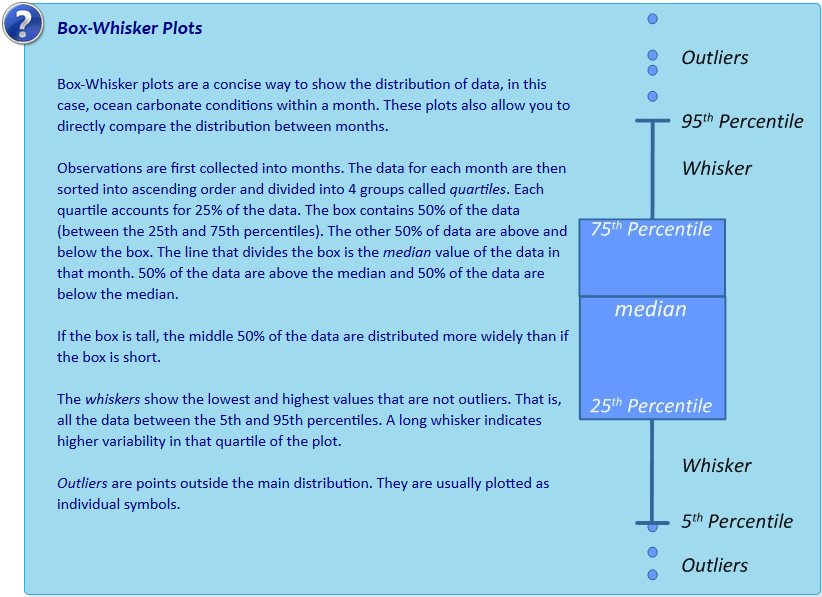
Interactive box plots below are observations binned by month as described in Sutton et al., 2016. Pie charts represent % of observations within each month that fall below the adjustable line. This adjustable line is meant to provide a tool for assessing potential biological thresholds. For example, setting the line to Ωaragonite of ~2.0 would assess monthly exposure of Pacific oyster larvae to sub-lethal chronic effects in regions where these larvae occur naturally or in hatcheries (see studies here and here).