What's New Archive

Table 1: Tsunami load to seismic capacity building height parity and threshold for Washington locations.
The Journal of Structural Engineering (JSE) awarded the Chock et al.'s "Tsunami-Resilient Building Design Considerations for Coastal Communities of Washington, Oregon, and California” as their 2018 Best Journal Paper in the Structural Hazards category.
The paper, published in August 2018 and coauthored by Dr. Yong Wei (JISAO/PMEL), was selected by a committee composed of Associate Editors from about 300 papers accepted for publication in JSE last year.
In this paper, the authors provide guidance on implementing the ASCE 7-16 tsunami design provisions by state and local jurisdictions on the west coast, and connect the technical considerations of structural engineering with community resilience objectives and land use zoning coordination. For Risk Category II buildings in California, Oregon and Washington, the paper finds that the current seismic design systemic capacity of buildings will be sufficiently strong to resist the overall tsunami design load. However, coastal buildings in several locations in Oregon and Southern Washington would not have sufficient seismic design strength to resist tsunami loads; for these locations, the authors stress the importance of implementing zoning polices and structural resiliency through tsunami strengthening (Table 1).
On February 4, Dr. Michelle McClure joined the Pacific Marine Environmental Lab as the fourth director. Michelle joins PMEL from NOAA Fisheries Northwest Science Center where she served as the Director of the Fishery Resources Analysis and Monitoring Division.
McClure brings to the laboratory 20 years of research and leadership experience with NOAA Fisheries where she made significant contributions to fisheries science for sustainable fisheries and protected resources. Under her direction, McClure expanded collaboration and research while supporting the core services NOAA provides to the West Coast fisheries industry and the Pacific Fisheries Management Council.
McClure, an evolutionary ecologist by training, joined NOAA’s Northwest Fisheries Science Center in 1999 as the Columbia River Salmon Science Coordinator. Her research has focused on conservation, population ecology, and ecosystem management. She has been a leader in the development of recovery plans for salmon and steelhead, iconic West Coast fish species. She served as a representative to the United Nations-sponsored Bay of Bengal Large Marine Ecosystem Project and helped develop scientific guidance on climate change and the Endangered Species Act.
McClure holds a bachelor of science in interdisciplinary studies (ecology) from Evergreen State College and a doctorate in ecology and evolutionary biology from Cornell University.
Please join PMEL in congratulating and welcoming Dr. McClure. We are very pleased to have Michelle join us!
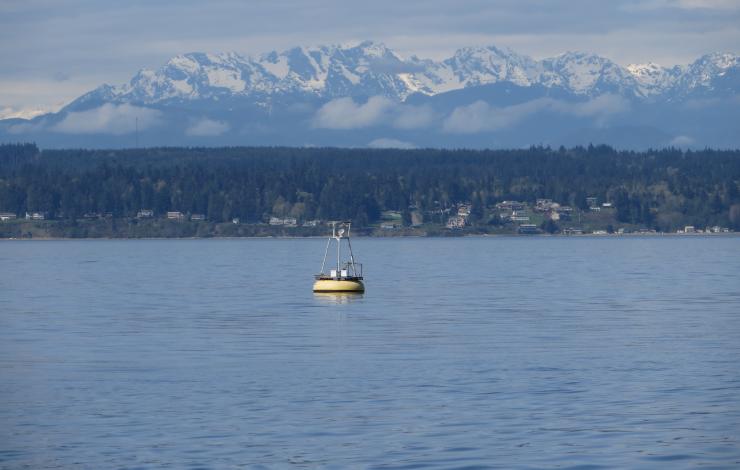
PMEL moored pCO2 (MAPCO2) systems have been installed on NANOOS Oceanic Remote Chemical Analyzer (ORCA) buoys in Twanoh and Dabob Bay as a collaborative effort between PMEL and the University of Washington to collect carbon dioxide data in Puget Sound. Photo Credit: Wendi Ruef/University of Washington
A new report finds that Puget Sound’s unusually warm water temperatures that prevailed throughout the West Coast since 2014 finally returned to normal in 2017. Although water temperatures recovered, life within those waters has not. In general, biological observations within Puget Sound revealed that the abundance of many marine animals throughout the food web are still lower than usual. In addition, the region experienced both the wettest spring and driest summer ever recorded in 2017.
The report combines a wealth of data from comprehensive monitoring programs and provides a concise summary of what was happening in Puget Sound’s marine waters during 2017. It covers areas such as climate and weather, river inputs, seawater temperature, salinity, nutrients, dissolved oxygen, ocean pH, phytoplankton, biotoxins, bacteria and pathogens, shellfish resources, and more.
The Puget Sound Ecosystem Monitoring Program’s Marine Waters Work Group, who authored the report, has been tracking the health of Puget Sound since 2011. This work group includes scientists from federal, tribal, state and local agencies, academia, nonprofits, and private and volunteer groups.
The work group looked at a number of environmental indicators, including plankton, water quality, climate, and marine life that when, considered together, provide both a long-term view and current assessment of the Sound’s health.
Simone Alin, Richard Feely, Adrienne Sutton, and Sylvia Musielewicz with PMEL's Carbon Program contributed to sections on ocean acidification and ocean and atmospheric CO2. Nick Bond with UW/JISAO and NOAA/PMEL contributed to sections on large-scale climate variability and wind patterns.
Read the full report here.
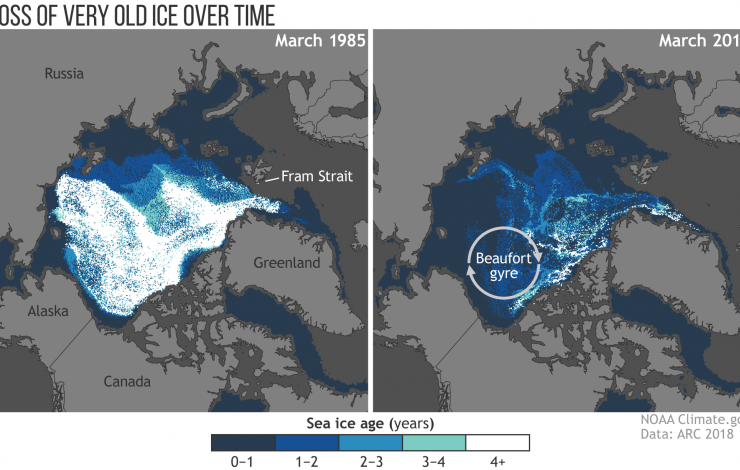
These maps show the age of sea ice in the Arctic ice pack in March 1985 (left) and March 2018 (right). Less than 1 percent of Arctic ice has survived four or more summers. See more visual highlights of the Arctic Report Card on NOAA climate.gov
December 11 - NOAA released the 2018 Arctic Report Card at the American Geophysical Union fall meeting in Washington, D.C today bringing together the work of 81 scientists from 12 nations to provide the latest in peer-reviewed, actionable environmental information on the current state of the Arctic environmental system relative to historical records.
The Arctic continued it long-term warming trend in 2018, warming at twice the rate relative to the rest of the globe with Arctic air temperatures for the past five years (2014-18) exceeding all previous records since 1900. Arctic sea ice in 2018 remained younger, thinner, and covered less area than in the past. The 12 lowest extents in the satellite record have occurred in the last 12 years. In the Bering Sea, winter sea ice extent reached a record low for virtually the entire 2017-2018 ice season, which typically begins to form at the beginning of October, expands through the winter and then melts through the spring. During two weeks in February, typically the height of winter, the Bering Sea lost significant ice cover, about ~215,000 km2 or about the size of Idaho. Ocean primary productivity levels in 2018 were sometimes 500% higher than normal levels in the Bering Sea which is linked to the record low sea ice extent in the region. The Bering Sea is an important commercial fishing region and supports a vibrant sea ice-ecosystem with abundant seals, birds, and other pelagic species that critically depend on the timing of sea ice formation and retreat.
Continued warming of the Arctic atmosphere and ocean are driving broad change in the environmental system in predicted and, also, unexpected ways. New emerging threats are taking form and highlighting the level of uncertainty in the breadth of environmental change that is to come. For more details, visit the Arctic Report Card website: https://arctic.noaa.gov/Report-Card
PMEL’s Dr. James Overland and Dr. Muyin Wang co-authored the surface air temperature essay and Dr. Carol Ladd co-authored the sea surface temperature essay.
Read the NOAA Press Release here.
Watch the video highlights on YouTube here
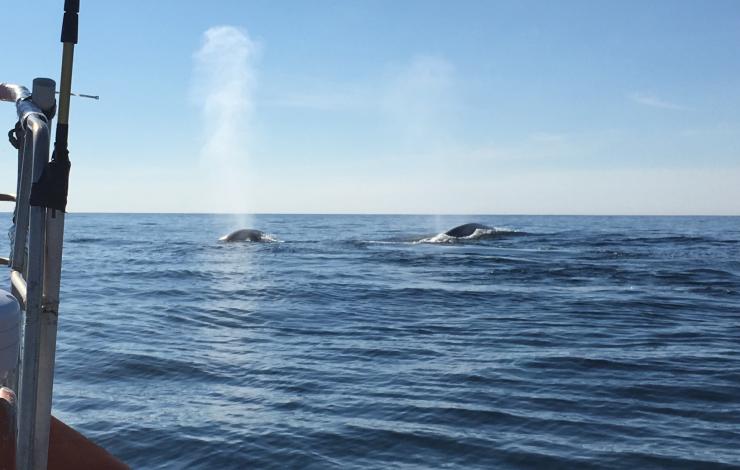
Two blue whale spouts seen from the boat on October 17, 2018. Photo taken under NMFS permit 20465
On October 17, 2018, a joint NOAA/PMEL and Oregon State University Marine Mammal Institute (OSU-MMI) team, with the assistance of a U.S. Coast Guard helicopter on patrol providing real time radio reports of cetacean sightings, traveled 27 miles off the Oregon coast (due west of Newport, Oregon) to acquire acoustic recordings and biopsy two North Pacific blue whales. Through MMI contacts, the Coast Guard helicopter out of North Bend spotted blue whales off shore during routine patrol, and alerted the team to their approximate location.
A PMEL drifting hydrophone was used to record the blue whale calls, while OSU-MMI personnel successfully collected a biopsy sample of one of the two blue whales, and documented the encounter with photographs. Genetic results show the biopsied animal was a male, acoustic analysis of call signal strength shows two animals observed during biopsying were likely source of recorded vocalizations. The researchers are currently doing further genetic analysis and photo identification work to confirm blue whale population and gender of animals recorded. These data will be used to correlate the genetic identity and acoustic call type of a North Pacific blue whale.
The goal is to quantify and relate call signal characteristics and genetic identity. Typically, only remote recordings of blue whale calls are used to assess population size and distribution of this endangered species.
All research was conducted under NMFS permit 20465 with the support of the Marine Mammal Institute whale telemetry group.

Example of tsunami inundation simulation shows model amplitudes during tsunami flooding computation at Okinawa study site, 57 min:15 sec after generation by a local earthquake source.
The University of Washington and NOAA Center for Tsunami Research at PMEL recently conducted a study for Department of Defense (DOD) overseas sites to ensure compliance of tsunami inundation modeling with recently established standards and guidelines by the American Society for Civil Engineers (ASCE). This update helps assess tsunami hazard at DOD facilities and identifies compliant design parameters for construction in tsunami hazard zones.
An extensive modeling effort for 23 Navy sites in the Pacific established detailed tsunami hazard zone maps in coastal areas and provided modeling data for building design guidance for tsunami-resistant buildings within the hazard zones.
No design criteria had existed in U.S. to address tsunami loads and effects on buildings before 2016. This work followed the new and first guidance from the American Society for Civil Engineers (ASCE 7-16)established in 2016, for constructions in tsunami hazard zones. The guidance requires establishing the hazard maps for the 2,500-year tsunami event, consistent with the National Seismic Hazard Maps, using probabilistic methods. This approach required intensive modeling efforts including hundreds of simulations with very high-resolution models for sources from areas prone to earthquakes that may trigger tsunamis, including the Ryukyu, Japan-Kuril, Mariana and Alaska-Aleutian trenches.
This project is funded by Navy Facilities and the National Institute of Building Science.
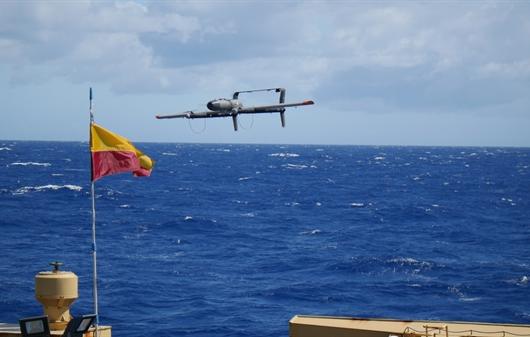
Launch of a 20-lb test VTOL-Fixed Wing hybrid UAS from the NOAA RV Oscar Elton Sette in June 2016.
A hybrid quadrotor (HQ) unmanned aircraft systems (UAS) platform with the ability of vertical take-off and landing (VTOL) and conversion to fixed wing (FW) flight allows for operations from ships, where launch and recover space is constrained while maintaining the range and endurance of a FW aircraft. The HQ technology eliminates the need for rail launchers and aerial capture technologies such as large nets and wires. With a capability of carrying a 15 lb payload and an endurance of 5 to 15 hours such an HQ UAS would greatly enhance many areas of NOAA research including climate and air quality studies, fishery and mammal surveys, oil spill detection, weather observations, and post severe weather damage assessments. With funding from the NOAA UAS Program Office, the Atmospheric Chemistry Group at NOAA PMEL has been working toward building this capability within NOAA with the goal of making vertical measurements of aerosol properties from a NOAA ship.
In June of 2016, PMEL worked with Latitude Engineering (now L3 Latitude) proving the concept of VTOL-FW launch and recovery of a 20-lb test HQ UAS from the NOAA RV Oscar Elton Sette. With lessons learned from those tests, L3 Latitude is currently in the second phase of a NOAA Small Business Innovation Research (SBIR) to develop an HQ-55 UAS able to fly autonomously from a NOAA ship. The HQ-55 is being designed with a 15-lb payload capability, 5 to 15-hour flight endurance depending on payload weight, and an altitude ceiling of 14,000 ft. At a total weight of under 55-lbs (including the payload) the HQ-55 will be compliant with FAA Part 107 which allows for the operation of UAS in National Airspace.
In a parallel effort, PMEL is developing an aerosol payload for integration into the HQ-55 with instruments able to measure total particle number concentration, particle number size distribution, aerosol light absorption, solar irradiance and sky radiance, aerosol composition, and meteorological parameters. The payload is modular in design to allow for quick swapping in and out of the UAS so that multiple payloads, each with different measuring capabilities, can be used during a given observation period. A previous version of the payload was flown in the Arctic (Svalbard, Norway) in 2011 and 2015 to investigate climate impacts of soot pollution. Through that work, the aerosol payload transitioned to Technical Readiness Level 8, system demonstration in an operational environment.
First shipboard tests of the HQ-55 with the integrated aerosol payload are planned for Spring 2019 from a NOAA ship. As part of these flights, NOAA pilots will continue training to fly the HQ-55. Through a collaboration between NOAA PMEL, the UAS Program Office, the Office of Marine and Aviation Operations, and the SBIR Program Office, the ultimate goal is to provide a VTOL-FW UAS capability within NOAA for use by all line offices through the Aircraft Operations Center.
Learn more about NOAA's Unmanned Aircraft Systems Program here: https://uas.noaa.gov/
Learn more about PMEL's Atmospheric Chemistry Group: https://saga.pmel.noaa.gov/
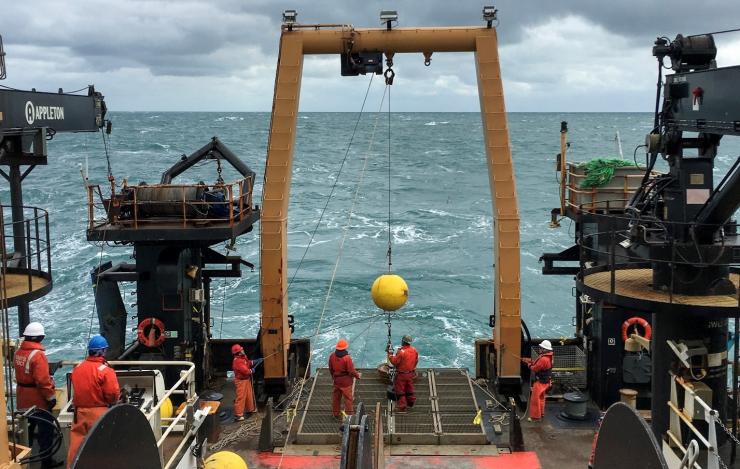
Acoustic Doppler Current Profiler (ADCP) subsurface mooring being deployed in the Bering Sea from the NOAA Ship Oscar Dyson.
This weekend, the EcoFOCI program completed its eleventh and final research cruise of its field season on the F/V Aquila to maintain and enhance an innovative array of biophysical moorings in conjunction with annual ship-based hydrographic data in the Bering Sea.
The team recovered 14 and deployed 10 moorings, including swapping the M2-site surface mooring for a sub-surface mooring to prevent damage from the ice to ensure 25 years of nearly continuous data. Scientists from PMEL, NOAA Fisheries Alaska Science Center and University of New Hampshire also collected some measurements from a CTD (conductivity-temperature-depth), nutrients, oxygen, plankton and larval fish along the Distributed Biological Observatory (DBO) Line 1, which has only been sampled once in 2017. These DBO lines are designated “hot spots” centered on locations of high productivity, biodiversity and rates of biological change in the Bering, Chukchi, and Beaufort seas.
Results from these observations and experiments will help describe important ecosystem linkages among climate, plankton, fishes, birds and mammals. Continuous monitoring from this region provides critical data to support sustainable management of living resources in the Bering Sea.
The EcoFOCI program is a collaborative research effort by scientists at the Pacific Marine Environmental Lab (PMEL) and Alaska Fisheries Science Center (AFSC) focusing on the unique and economically important high-latitude ecosystems of Alaska.
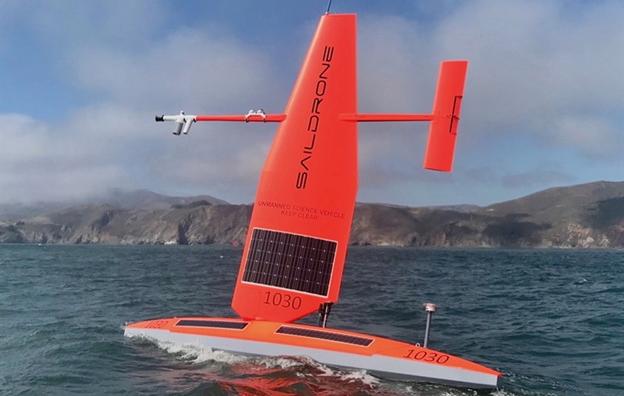
The Saildrone is an autonomous sailing drone currently being explored as a tool to provide high quality oceanic and atmospheric observations (Photo Credit: Saildrone, Inc.).
This week, four saildrones departed from Hawaii on the second mission to the equator in an effort to improve the Tropical Pacific Observing System (TPOS). NOAA forecasts a 50-55% chance of a weak El Niño developing during September - November 2018, increasing to 65-70% chance during winter 2018-19. The second saildrone mission will thus capture ocean and atmospheric data during this developing El Niño, including changes in ocean temperature, winds, currents and ocean carbon dioxide concentrations.
During the first mission in late 2017-early 2018, La Niña conditions were present. Strong currents and low winds on the equator made navigation challenging. This year, two of the four saildrones have been outfitted with larger, more efficient sails, making them faster and more capable in low wind-strong current environments.
This mission is part of a series of saildrone missions to the tropical Pacific, focusing on how this new technology could best be used within the TPOS to improve longterm weather forecasts.
PMEL began a partnership with Saildrone, Inc. in 2014 to develop the unmanned surface vehicles for collecting high quality oceanic and atmospheric observations. PMEL's Ocean Climate Stations group has been working together with PMEL engineers and Saildrone, Inc. since 2016 to install sensors on the drones with equivalent or better quality than those currently used on TAO moorings for air-sea flux measurements.
Follow the TPOS Saildrones’ progress at: https://www.pmel.noaa.gov/ocs/ocs-saildrone-mission-blog-tpos-mission-2
This mission is supported by NOAA Research's Global Ocean Monitoring and Observing Program, NOAA's Office of Marine and Aviation Operations and Saildrone, Inc.
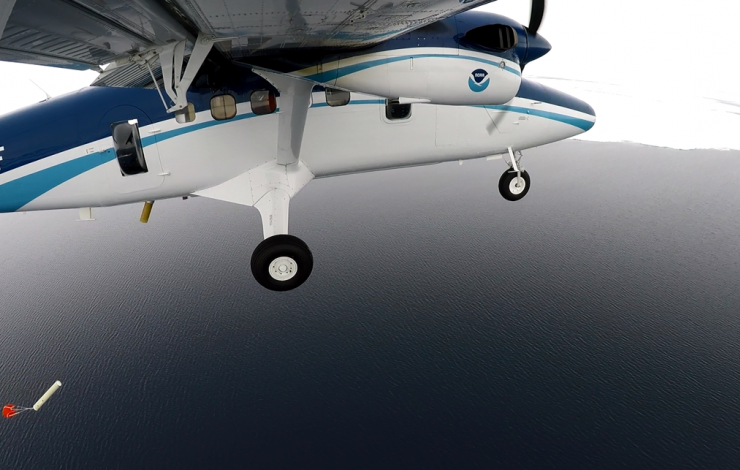
Deployment of an Airborne eXpendable Current Profilers (AXCP) from the NOAA Twin Otter during the 2018 Arctic Heat flight campaigns over the Chukchi Sea (Photo Credit: Kevin Wood).
Seasonally ice-covered marginal seas are among the most difficult regions in the Arctic to study. The scarcity of observing systems in these areas also hinders forecast services in the region and is a major contributor to large uncertainties in modeling and related climate projections. The Arctic Heat Open Science Experiment strives to fill this observation gap with an array of innovative autonomous floats and other near real-time weather and ocean-sensing systems that allow for continuous monitoring of changing conditions in the Chukchi Sea. Since 2016, over 1,000 Arctic Ocean profiles have been collected by the Arctic Heat project and transmitted in real-time via the Global Telecommunications System (GTS). Data collected during the 2017 field season showed particular warmth in the lower ocean which was a leading factor for the record late freeze up (1 month later than usual) in the region and likely would not have been detected without this field campaign. This event caused a ripple effect including impacts on whale migration patterns, physical ocean circulation patterns and subsistence hunt practices that depend on ice.
This week, researchers aboard the NOAA Twin Otter are launching various atmospheric and oceanographic probes and floats as part of the third and final flight campaign of 2018. They will launch an Air-Launched Autonomous Micro-Observer (ALAMO) profiling float and 20 Airborne eXpendable BathyThermographs (AXBT) and carry out a set of low level surveys around the R/V Sikuliaq using LIDAR, longwave radiometry, and thermal imaging. They will also be on the lookout for higher wind/wave situations to collection additional data for NASA's Ice, Cloud and land Elevation Satellite (ICESat) 2 which will be launched on September 14.
Arctic Heat is an open science experiment, publishing data generated by the project to further NOAA's Science Missions with real-time data to facilitate timely observations for use in weather and sea-ice forecasts, to make data readily accessible for model and reanalysis assimilation, and to support ongoing research activities across disciplines.
This mission is in coordination with the Office of Naval Research (ONR)'s Stratified Ocean Dynamics of the Arctic (SODA) in response to the White House Office of Science and Technology Policy's "Interagency Research Effort To Improve Weather, Ice, and Water Forecasting in the Arctic Ocean" led by ONR, NOAA, National Science Foundation, Bureau of Ocean Energy Management (BOEM) and NASA. Arctic Heat is a joint effort of NOAA Pacific Marine Environmental Laboratory (PMEL) Arctic Research, the Innovative Technology for Arctic Exploration (ITAE) program, the ALAMO development group at the Woods Hole Oceanographic Institution (WHOI), and the Joint Institute for the Study of the Atmosphere and Ocean (JISAO) at the University of Washington.