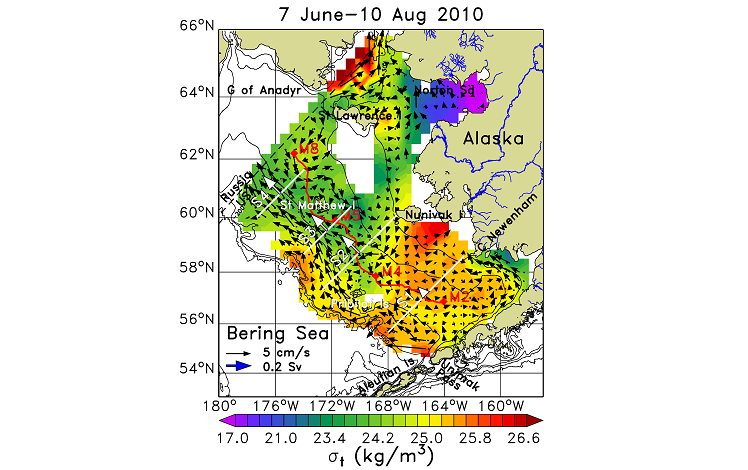
This map shows the water density (σt = density–1000 kg/m3) and surface currents (black arrows) on the eastern Bering Sea continental shelf as determined from measurements of the ocean temperature and salinity. White arrows show the total transport (1 Sv=106 m3/s) of water across sections S1-S4.
In the summers of 2008–2010, Dr. Ned Cokelet added rugged instruments to NOAA bottom trawl survey nets on the eastern Bering Sea continental shelf – site of the nation’s most productive fisheries – to measure ocean temperature and salinity at over 350 locations. The results, released in Deep Sea Research II, provide the most comprehensive view to date of the three-dimensional thermohaline structure. Horizontal variations of the ocean’s mass density, computed from the temperature and salinity measurements, give the ocean currents shown by arrows in the accompanying figure for summer 2010. The flow was strongest west of the Pribilof and St. Matthew Islands, and there was clockwise circulation around St. Matthew Island. The upper layer of the ocean was mixed down to less than 30 m over much of the region, but reached depths greater than 70 m along the Alaska Peninsula. Upper-to-lower layer salinity differences contributed more than temperature to density differences over most of the region. These observations enhance our understanding of plankton and fish-larval transport and can serve to calibrate predictive computer models of the ecosystem.