What's New Archive

Image of the Willamette River in Portland, OR where the Ocean Sciences Meeting will take place.
More than 50 PMEL scientists, including scientists from NOAA, University of Washington's Joint Institute for the Study of the Ocean and Atmosphere (JISAO), Oregon State University's Cooperative Institute for Marine Resources Studies (CIMRS) and the National Research Council, will present a talk or share a poster on their research at the 2018 Ocean Sciences Meeting in Portland, Oregon February 12-16, 2018. PMEL research groups that will be present at the conference are: Acoustics, Arctic, Earth-Ocean Interactions, EcoFOCI, Engineering, Global Tropical Moored Buoy Array, Innovative Technology for Arctic Exploration, Large Scale Ocean Physics, Ocean Carbon, Ocean Climate Stations, Pacific Western Boundary Currents, Science Data Integration Group, Thermal Modeling and Analysis Project
28 talks will present research on ocean carbon, ocean acidification, ocean observing systems, Arctic research including the Distributed Biological Observatory and Arctic Marine Pulses (AMP), ENSO, MJO, hydrothermal vents, Saildrone research, air-sea interactions, SOCCOM, and ocean mixing. 26 posters will be up during the poster sessions and highlight research in the Arctic, hydrothermal vents, acoustics, methane bubbles and hydrates, Saildrone, Oculus Coastal Glider, ocean carbon, deep ocean temperatures, glider research in the Solomon Sea, and ocean acidification and hyopxia.
PMEL staff will also be chairing sessions and workshops on:
- El Nino-Southern Oscillation (ENSO) Diversity, Predictability, and Impacts
- Western Pacific and Indonesian Sea Circulation and Its Environmental and Climatic Impacts
- New Platform and Sensor Technologies: Advancing Research, Readiness, and Transitioning for Sustained Ocean Observing of Essential Ocean Variables
- Methane from the Subsurface Through the Bio-, Hydro-, and Atmosphere: Advances in Natural Hydrate Systems and Methane Seeps in Marine Ecosystems
- Cascadia Margin methane seep and hydrates to share results and coordinate future work
The 2018 Ocean Sciences Meeting is co-sponsored by the American Geophysical Union (AGU), the Association for the Sciences of Limnology and Oceanography (ASLO), and The Oceanography Society (TOS). The meeting is an important venue for scientific exchange across broad marine science disciplines. Sessions will include all aspects of oceanography, especially multidisciplinary topics, as well as presentations that reflect new and emerging research on the global ocean and society, including science education, outreach, and public policy
In a new study published in Science, NOAA and NASA scientists used space-borne observations of carbon dioxide (CO2) from NASA’s Orbiting Carbon Observatory-2 satellite, or OCO-2, to characterize the tropical atmospheric CO2 response to the strong El Niño event of 2015-2016. The El Niño provided NASA and NOAA an unprecedented opportunity to test the effectiveness of this new observation tool. OCO-2 is NASA’s first satellite designed to measure atmospheric carbon dioxide with the precision, resolution, and coverage necessary to quantify regional carbon sources and sinks.
Observations of carbon dioxide concentrations over the tropical Pacific from the satellite were validated by data from NOAA’s Tropical Pacific Observing System of buoys, which directly measure carbon dioxide concentrations at the surface of the ocean. Both observing systems showed that in the early months of the El Niño, during the spring of 2015, outgassing of carbon dioxide over the tropical Pacific Ocean significantly declined by 26 to 54 percent.“This response is consistent with what we expect from a theoretical understanding, and comparable to what the NOAA data suggests,” said Richard Feely, senior scientist at NOAA’s Pacific Marine Environmental Laboratory, who is a co-author on the paper.
This research is part of a series of studies to better understand the growth of carbon dioxide concentrations in the global atmosphere using the new NASA satellite. The studies show how various regions contribute to those emissions or serve as sinks, absorbing carbon dioxide emissions at different times.
Two Saildrones headed to the tropical Pacific Ocean to enhance the Tropical Pacific Observing System

A saildrone as it passes the Golden Gate Bridge in San Francisco, CA. Photo Credit: Saildrone, Inc.
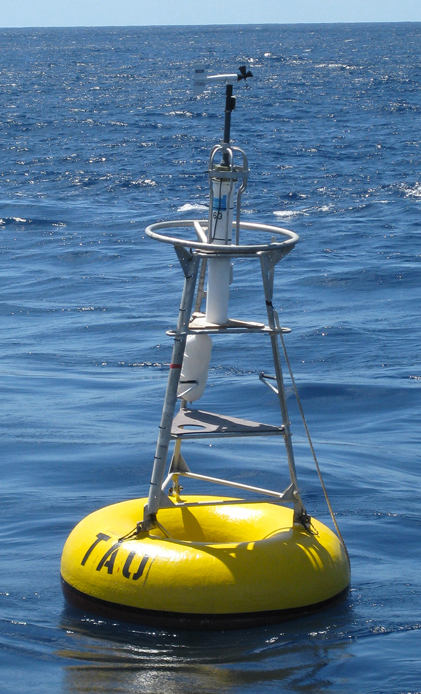
On September 1, two saildrones launched from the Saildrone Inc. dock in Alameda, CA to begin their six-month, 8,000-nautical-mile, round-trip mission to the equator to improve the Tropical Pacific Observing System (TPOS). These saildrones are a component of a broader effort to rethink the Tropical Pacific Observing System (TPOS) that supports sub-seasonal to seasonal forecasting for the US. TPOS provides real-time data used by the US and partner nations to forecast weather and climate, including El Nino. The mission will be testing if this new, enhanced tool can collect a variety of measurements at a quality that matches research ships and proven mooring technology, Tropical Atmosphere Ocean (TAO) array. If this is the case, they may become a powerful tool to provide key observations for weather forecasts.
The saildrones are headed to the California Current Ecosystem (CCE) for a short test before taking part in a larger field study with NASA at the NASA SPURS study site in the eastern Tropical Pacific. The saildrones will perform an intercomparison with the Woods Hole Oceanographic Institution’s (WHOI) buoy and collect observational date in the study site. The saildrones will also do a calibration exercise with a research ship to ensure the accuracy and quality of the measurements that are being collected. This is particularly important to scientists when testing new sensors and technologies. Then the saildrones will travel south to the equator to do intercomparisons with the TAO moorings before heading back to Alameda, CA.
If the mission is successful, the improved data collection can help improve forecasts for El Nino’s and other weather phenomena that develop in the tropical Pacific and strongly impact North American weather patterns.
Read more about the Saildrone missions in the Arctic and the Tropical Pacific here.
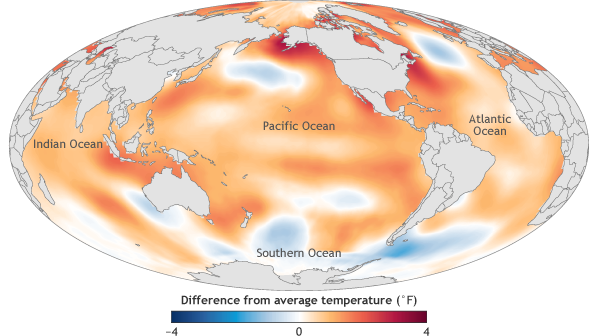
The image is of ocean surface temperature in 2016 compared to the 1981-2010 average. Despite the weakening 2015/16 El Niño event in 2016, the global average sea surface temperature in 2016 beat 2015 as the warmest year on record by a narrow margin. Image credit: NOAA Climate.gov map, adapted from Figure 3.1a in State of the Climate in 2016.
On August 10th, the State of the Climate in 2016 was published in a special edition of the Bulletin of the American Meteorological Society. This 27th annual report is based on contributions from more than 500 scientists representing over 60 countries around the world. It is the most comprehensive annual summary of Earth’s climate and provides a detailed update on global climate indicators, notable weather events and other data collected from locations on land, water, ice, and in space.
PMEL, including JISAO and JIMAR, scientists contributed to sections on the global ocean carbon cycle, ocean heat content and arctic air temperature.
The new report confirmed that 2016 surpassed 2015 as the warmest year in 137 years of recordkeeping. Several climate indicators also set new records in 2016, including greenhouse gas concentrations, sea level, and sea surface temperature. The Arctic also continued to warm with average Arctic land surface temperature 3.6°F (2.0°C) above the 1981-2010 average and sea ice extent and thickness remained low.
Dr. Gregory C. Johnson, PMEL oceanographer and editor for the ocean chapter, sums up in Haiku form:
Large El Niño wanes,
east Pacific tropics cool,
seas shed heat, slow rise
Read the full report, press release and report highlights.
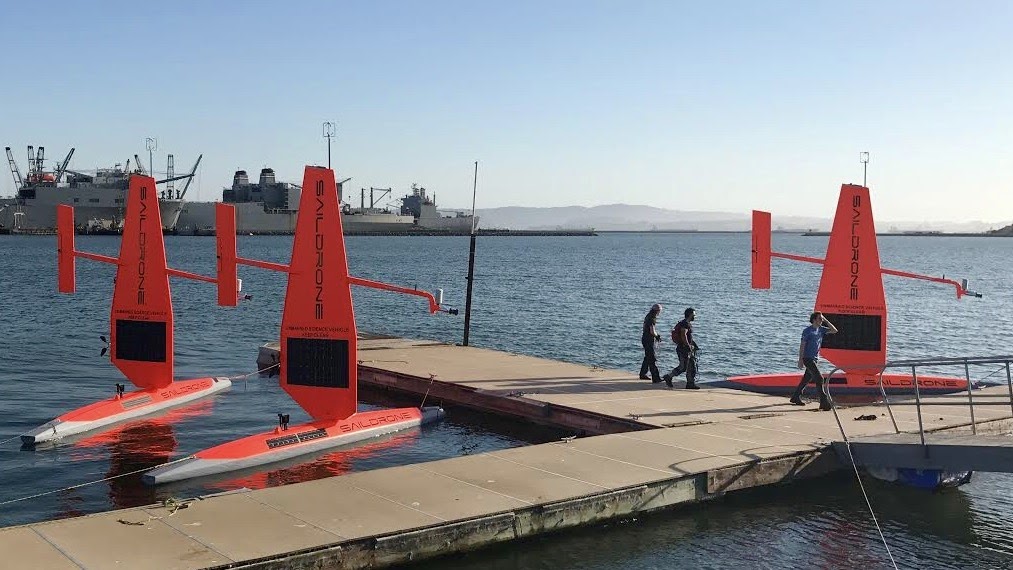
The fleet of saildrones pictured here are being prepared for a summer and fall of science from the Bering Sea to the Arctic to the far reaches of the tropical Pacific Ocean. Credit: Saildrone Inc.
Over the next four months, NOAA scientists will launch unmanned ocean vehicles, called Saildrones, from the Arctic to the tropical Pacific Ocean to help better understand how changes in the ocean are affecting weather, climate, fisheries and marine mammals. The wind and solar-powered research vehicles that resemble a sailboat will travel thousands of miles across the ocean, reaching some areas never before surveyed with such specialized technology.
Earlier this week, PMEL scientists and Saildrone, Inc. sent off three saildrones from Dutch Harbor, Alaska. For the first time, two saildrones will sail north through the Bering Strait into the Arctic Ocean to study how the Arctic Ocean is absorbing carbon dioxide. A third unmanned vehicle will survey more than 3,100 nautical miles in the Bering Sea for walleye pollock, Northern fur seals that prey on them and the elusive North Pacific right whale. This work will build on research conducted during 2016, including a study of fur seal feeding rates. NOAA Fisheries Alaska Fisheries Science Center scientists will also attach video cameras to fur seals to record feeding and verify the species and sizes of fish that fur seals are eating.
In September, scientists will launch two more unmanned systems from Alameda, Calif., on a six-month, 8,000-nautical-mile, round-trip mission to the equator to improve the Tropical Pacific Observing System (TPOS). TPOS provides real-time data used by the U.S. and partner nations to forecast weather and climate, including El Nino. The unmanned sailing vehicles will take part in a larger field study with NASA, and visit mooring sites along the array of observing buoys.
Read the release on NOAA Research here and follow along with the Innovative Technology for Arctic Exploration's Blog for the Bering and Chukchi Seas missions.

Dr. Chidong Zhang gave a talk at the NOAA Booth during AMS about his research on the Madden Julian Oscillation.
Last week, PMEL scientists attended the American Meteorological Society (AMS)’s Annual Meeting in Seattle, WA and the Alaska Marine Science Symposium (AMSS) in Anchorage, AK. Presentations covered research in the Bering Sea, data management and access, El Nino, sea ice, the Earth's energy imbalance, innovative technologies, and recent warming in the Pacific and others.
At AMSS, the Ecosystems and Fisheries-Oceanography Coordinated Investigations (EcoFOCI) group had multiple presentations and posters on the Bering Sea including topics on the recent marine heat wave in Alaska, linking annual oceanographic processes to contiguous ecological domains in the pacific Arctic, fish distributions, ecology, Saildrone and oceanography.
A wider range of topics were covered at AMS and included invited talks from Nick Bond, Chidong Zhang and Kevin Wood. Dr. Zhang spoke about the Dynamics of the Madden-Julian Oscillation; Kevin Wood presented the Old Weather Project using historical U.S. ship logbooks to collect and analyze historical climate data; and Nick Bond discussed the recent warming in the NE Pacific. The annual meeting is the world’s largest yearly gathering for the weather, water, and climate community and brings together atmospheric scientists, professionals, students, educators and research’s from around the world. AMS is the nation’s premier scientific and professional organization promoting and disseminating information about the atmospheric, oceanic, hydrologic sciences.
Learn more about all our different research themes and groups here.

Poster Hall at the Fall Meeting. There were approximately 24,000 attendees in 2015. (Photo Credit: AGU)
PMEL scientists, including scientists from the University of Washington's Joint Institute for the Study of the Ocean and Atmosphere (JISAO) and Oregon State University's Cooperative Institute for Marine Resources Studies (CIMRS) are attending the American Geophysical Union (AGU)’s Annual Meeting in San Francisco this week, December 12-16. AGU's Falling Meeting is the largest Earth and space science meeting in the world bringing together the Earth and space science community for discussions of emerging trends and the latest research. Poster and talk topics include data integration, El Nino Southern Oscillation (ENSO), Indian Ocean temperature trends, hydrothermal plumes and vents, carbon dioxide in the tropics and Gulf of Alaska, aerosol research, and heat impacts on marine ecosystems and fisheries, tsunamis, and acoustic research.
The 2016 Arctic Report Card will be released Tuesday morning in conjunction with a press conference led by NOAA’s Jeremy Mathis. The 2016 Arctic Report Card brings together the work of 61 scientists from 11 nations to provide the latest information on multiple measures of Arctic environmental change, including air and sea surface temperature, sea ice, snow cover, vegetation, wildlife, and plankton abundance. Read the full report and highlights here as well as the press release. Watch the recorded press conference here.
Researchers will also present during a press conference Thursday morning some of the first scientific results from the 2015 Axial Seamount eruption including discoveries of previously unknown structures and new glimpses into the volcano’s internal plumbing. These new insights into the world’s most active and well-studied underwater volcano may help scientists better understand all volcanoes and the hazards they pose. Read the press release here. Watched the recorded press conference here.
Dr. Bob Embley from the Earth-Ocean Interactions group will be honored during the Awards Ceremony as part of the 2016 class of Fellows for his pioneering contributions to the understanding of deep-sea volcanism by fostering interdisciplinary investigations with advanced technologies.
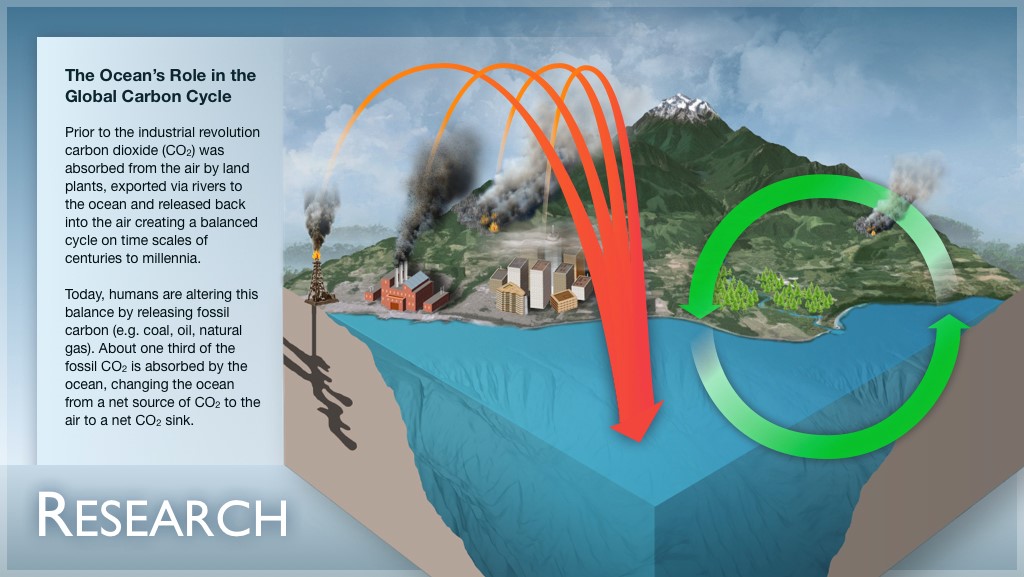
Prior to the industrial revolution CO2 was absorbed from the air by land plants, exported via rivers to the ocean and released back into the air creating a balanced cycle on time scales of centuries to millennia. Today, humans are altering this balance by releasing fossil carbon (e.g. coal, oil, natural gas). About one third of fossil CO2 is absorbed by the ocean, changing the ocean from a net source to the air, to a net sink.
Recent results published by the Global Carbon Project (GCP) earlier this month in Earth System Science Data show that global carbon emissions from burning fossil fuels did not grow in 2015 and are projected to rise only slightly in 2016, marking three years of almost no growth. The plateau in global emissions is largely the result of reduced coal use in China. However, emissions grew by 5.2% in 2015 in India, the world’s second most populous developing country, and other developing countries.
In spite of a nearly flat growth in emissions, the growth in atmospheric CO2 concentration was a record-high in 2015 and could be a record high again in 2016 due to weak carbon sinks. Carbon sinks refers to a reservoir that accumulates and stores carbon. Natural sinks are in the oceans and land plants, which typically absorb more carbon dioxide than they release. This past year, CO2 was not as readily absorbed by trees due to warm and dry conditions over tropical land caused by the recent 2015-16 El Niño event.
Atmospheric CO2 levels have exceeded 400 parts per million (ppm) and will continue to rise until emissions are reduced to near zero. This is the highest level for atmospheric CO2 in at least the last 800,000 years (See GCP Infographics for more details here).
PMEL scientists, Simone Alin, Adrienne Sutton, and Kevin O’Brien provided valuable data about CO2 in the oceans for this report. The Global Carbon Project was formed to develop a complete picture of the global carbon cycle, including the interactions and feedback between the natural and human systems.
Read the Global Carbon Budget 2016 article and highlights. To learn more, visit PMEL’s Carbon research page and the Global Carbon Project here.
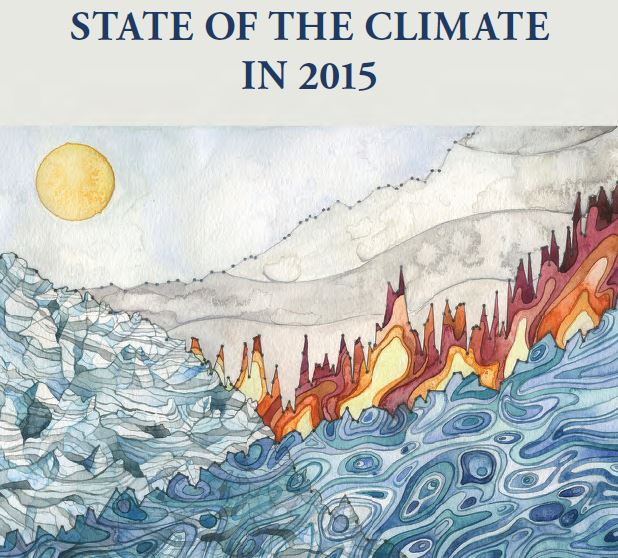
Landscape of Change by Jill Pelto. The cover image of the report reflects the connections between sea level rise, glacier volume decline, increasing global temperatures, and the increasing use of fossil fuels. These data lines compose a landscape shaped by the changing climate.
The State of the Climate in 2015 report, published August 2016 in the Bulletin of the American Meteorological Society, provides a detailed update on global climate indicators, notable weather events and other environmental data. The report was compiled by 460 scientists, including several PMEL, JISAO and JIMAR scientists. These scientists contributed to sections on the global ocean carbon cycle, ocean heat content and arctic air temperature.
This year’s report has an emphasis on ecosystems, specifically how a changing climate impacts living systems. The report confirmed that 2015 beat 2014 as the warmest year (about 1.0°C warmer) since preindustrial times and that the Mauna Loa observatory recorded its first annual mean carbon dioxide concentration greater than 400 ppm. This year’s exceptional warmth was fueled in part by a nearly year-round mature El Niño event.
Greg Johnson, who co-edited the Global Ocean’s chapter, wrote a haiku summarizing Earth’s climate in 2015:
El Niño waxes,
warm waters shoal, flow eastward,
Earth’s fever rises.
Read the full report, press release and report highlights.
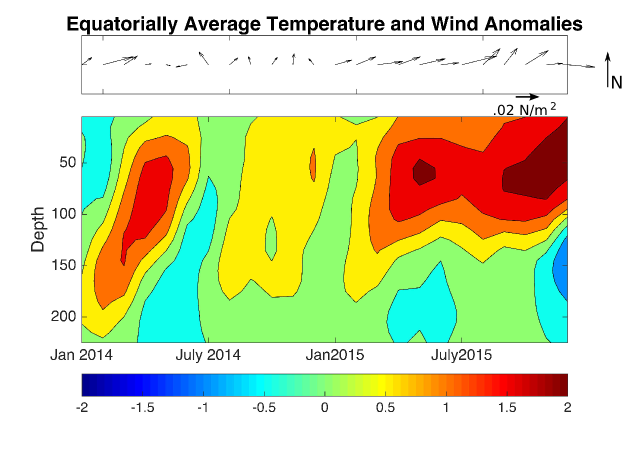
This image shows water temperature (in degrees Celsius) at varying ocean depths and wind stress anomalies, averaged over the equatorial Pacific (120E-80W, 2S-2N) from January 2014 - 2016. Red colors represent higher than normal temperatures and longer arrows represent stronger than normal winds.
PMEL climate scientists describe in a recently published paper the relationship between the 2014-15 failed El Niño and this year’s monster El Niño as well as any similarities between the past strong El Niño’s. They examined changes in sea surface and sub-surface temperatures, winds, and volumes of warm water in the Pacific Ocean from 2014 to 2016.
What they found was that the highly anticipated 2014-15 El Niño event failed due to unusually strong easterly winds in the summer of 2014 which prevented the warm surface water from shifting eastward as seen in a typical El Niño events and left a reservoir of warm water below the ocean’s surface. This reservoir of warm water combined with strong westerly winds that appeared and continued throughout the spring and summer of 2015 led to the monster El Niño. They found a similar series of events that led to the 1991-92 El Nino event.
Learn more about El Nino Research and read AGU’s press release on the paper.