What's New Archive

Typical La Niña wintertime pattern for the U.S.
A newly updated FAQ answers questions about La Niña, including explanations, detection, impacts and relationship to severe weather events such as hurricanes and tornados.
La Niña is defined as cooler than normal sea-surface temperatures in the central and eastern tropical Pacific ocean that impact global weather patterns. La Niña conditions recur every few years and can persist for as long as two years.
El Niño and La Niña are extreme phases of a naturally occurring climate cycle referred to as El Niño/Southern Oscillation, and both terms refer to large-scale changes in sea-surface temperature across the eastern tropical Pacific.
Both La Niña and El Niño tend to peak during the Northern Hemisphere winter.
To learn more, check out the La Niña FAQs, What is La Niña?, Today's El Niño / La Niña Status, the latest El Niño Forecasts, and El Niño YouTube videos.
YouTube Channel explains El Niño.
The new El Niño YouTube playlist is a resource including explanations of the predictability of El Niño, the 2014 El Niño that never materialized and the 2015-2016 El Niño that challenges the 1997-1998 El Niño for the largest on record
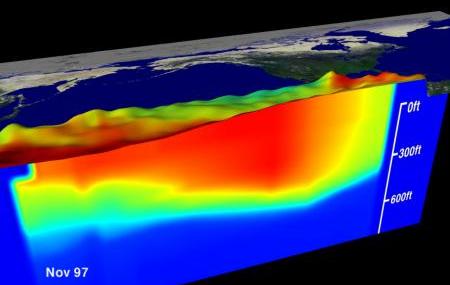
Learn how and why PMEL developed the El Niño observing system in the tropical Pacific, which includes a narrated animation of the evolution of the 1997-1998 El Niño, the largest on record at the time. You can also view a YouTube animation of the evolution of the 2009-2010 El Niño, which shows the strongest "Central Pacific" El Niño in the past 3 decades, with maximum warming in the central equatorial Pacific (vs the classic El Niño, like 1997-1998, with maximum warming in the eastern equatorial Pacific).
El Niño animations show changes in sea surface temperature in the tropical Pacific Ocean. As you view them, you will see the warm water spreading from the western Pacific to the eastern Pacific as the El Niño evolves. The bottom panel in the animations, labeled anomalies, shows temperature deviations from normal (how much the sea surface temperature is different from the long term average). The red color in the anomalies plot indicates that the temperature of the water is much warmer than is normal for that month, whereas blue color indicates that the water is much cooler than is normal. Animations of physical processes allow scientists to better understand the El Niño cycle.
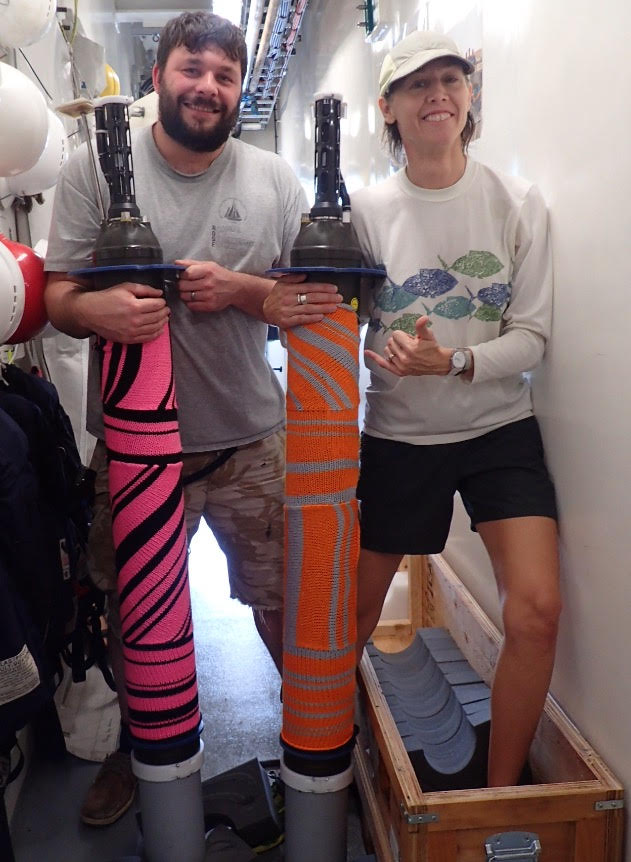
Two PMEL Argo floats nestled in knitted cozies held by Falkfor lead marine tech Leighton Rolley (left) and artist Michelle Schwengel-Regala (right). Photo credit: Schmidt Ocean Institute media journalist Monika Naranjo-Gonzales.
PMEL’s Argo float group relies upon and is very grateful for assistance from scientists and crew in deploying PMEL Argo floats on a variety of ships in oceans around the globe. PMEL Argo recently sent six floats to the R/V Falkor of the Schimdt Ocean Institute for deployment on a science cruise studying oxygen minimum zones across in the tropical Pacific. Float deployments during this cruise helped to fill a coverage gap in the Argo array that had opened up in this crucial region during a significant El Niño. As an unexpected bonus, artist-at-sea Michelle Schwengel-Regala was yarn-bombing on the Falkor during this cruise. Here are pictures of two PMEL Argo floats on the Falkor nestled in her dazzling knitted float-cozies! The yarn was removed and repurposed prior to deployment of the floats, all of which are now reporting vital ocean temperature and salinity data back from the tropical Pacific, monitoring the evolving El Niño.
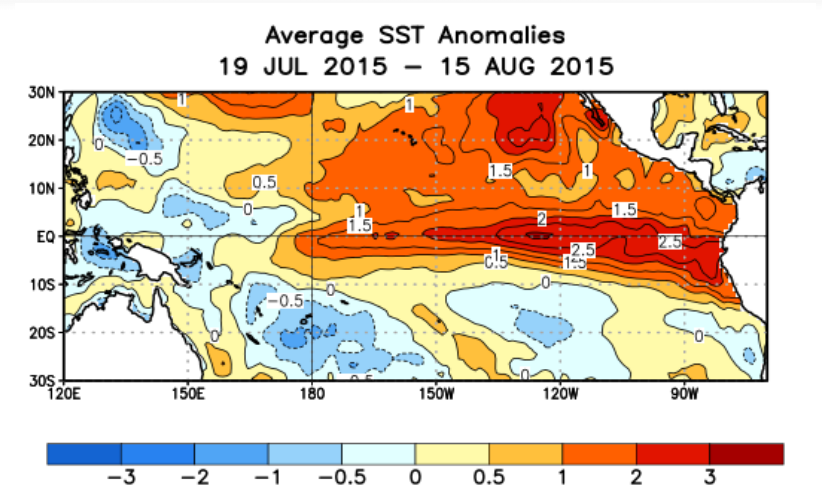
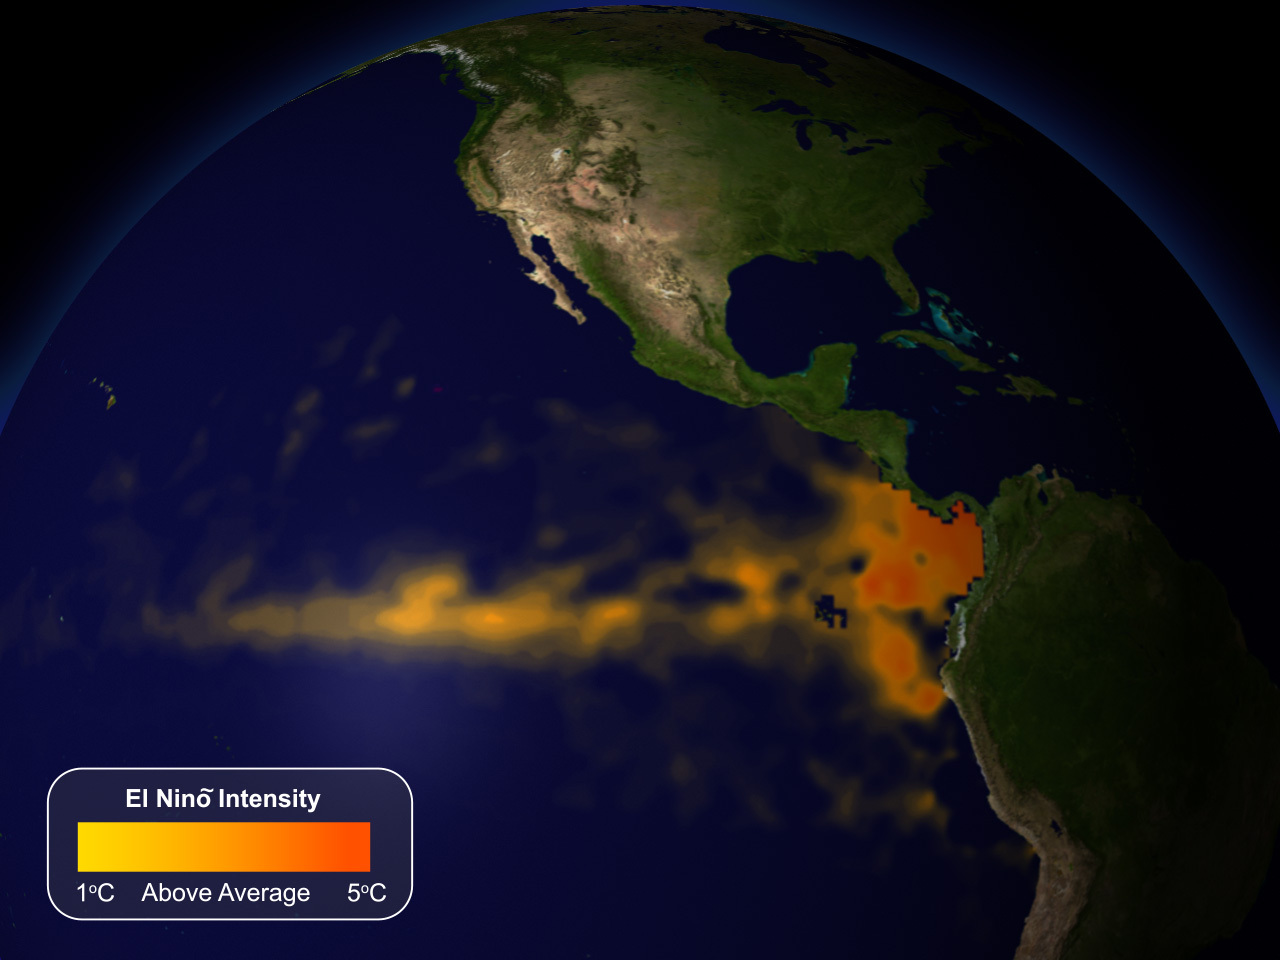
Current sea surface temperature anomalies in the tropical pacific, indicative of a strong El Niño.
Research and commentary articles just published online in Nature Climate Change by NOAA/PMEL Senior Scientist Michael McPhaden and collaborators highlights the need for continued study into El Niño causes and effects.
McPhaden’s commentary explores possible reasons why the much anticipated El Niño of 2014 failed to materialize, while an unforeseen strong El Niño is developing now. In the same issue, a review paper by McPhaden and colleagues explores the connection between global warming and El Niño/La Niña events. Model results indicate that extreme El Niño and La Niña events will increase in number and intensity as the climate continues to warm.
Read the commentary and research review on Nature Climate Change and the NOAA Press Release about current El Niño research.
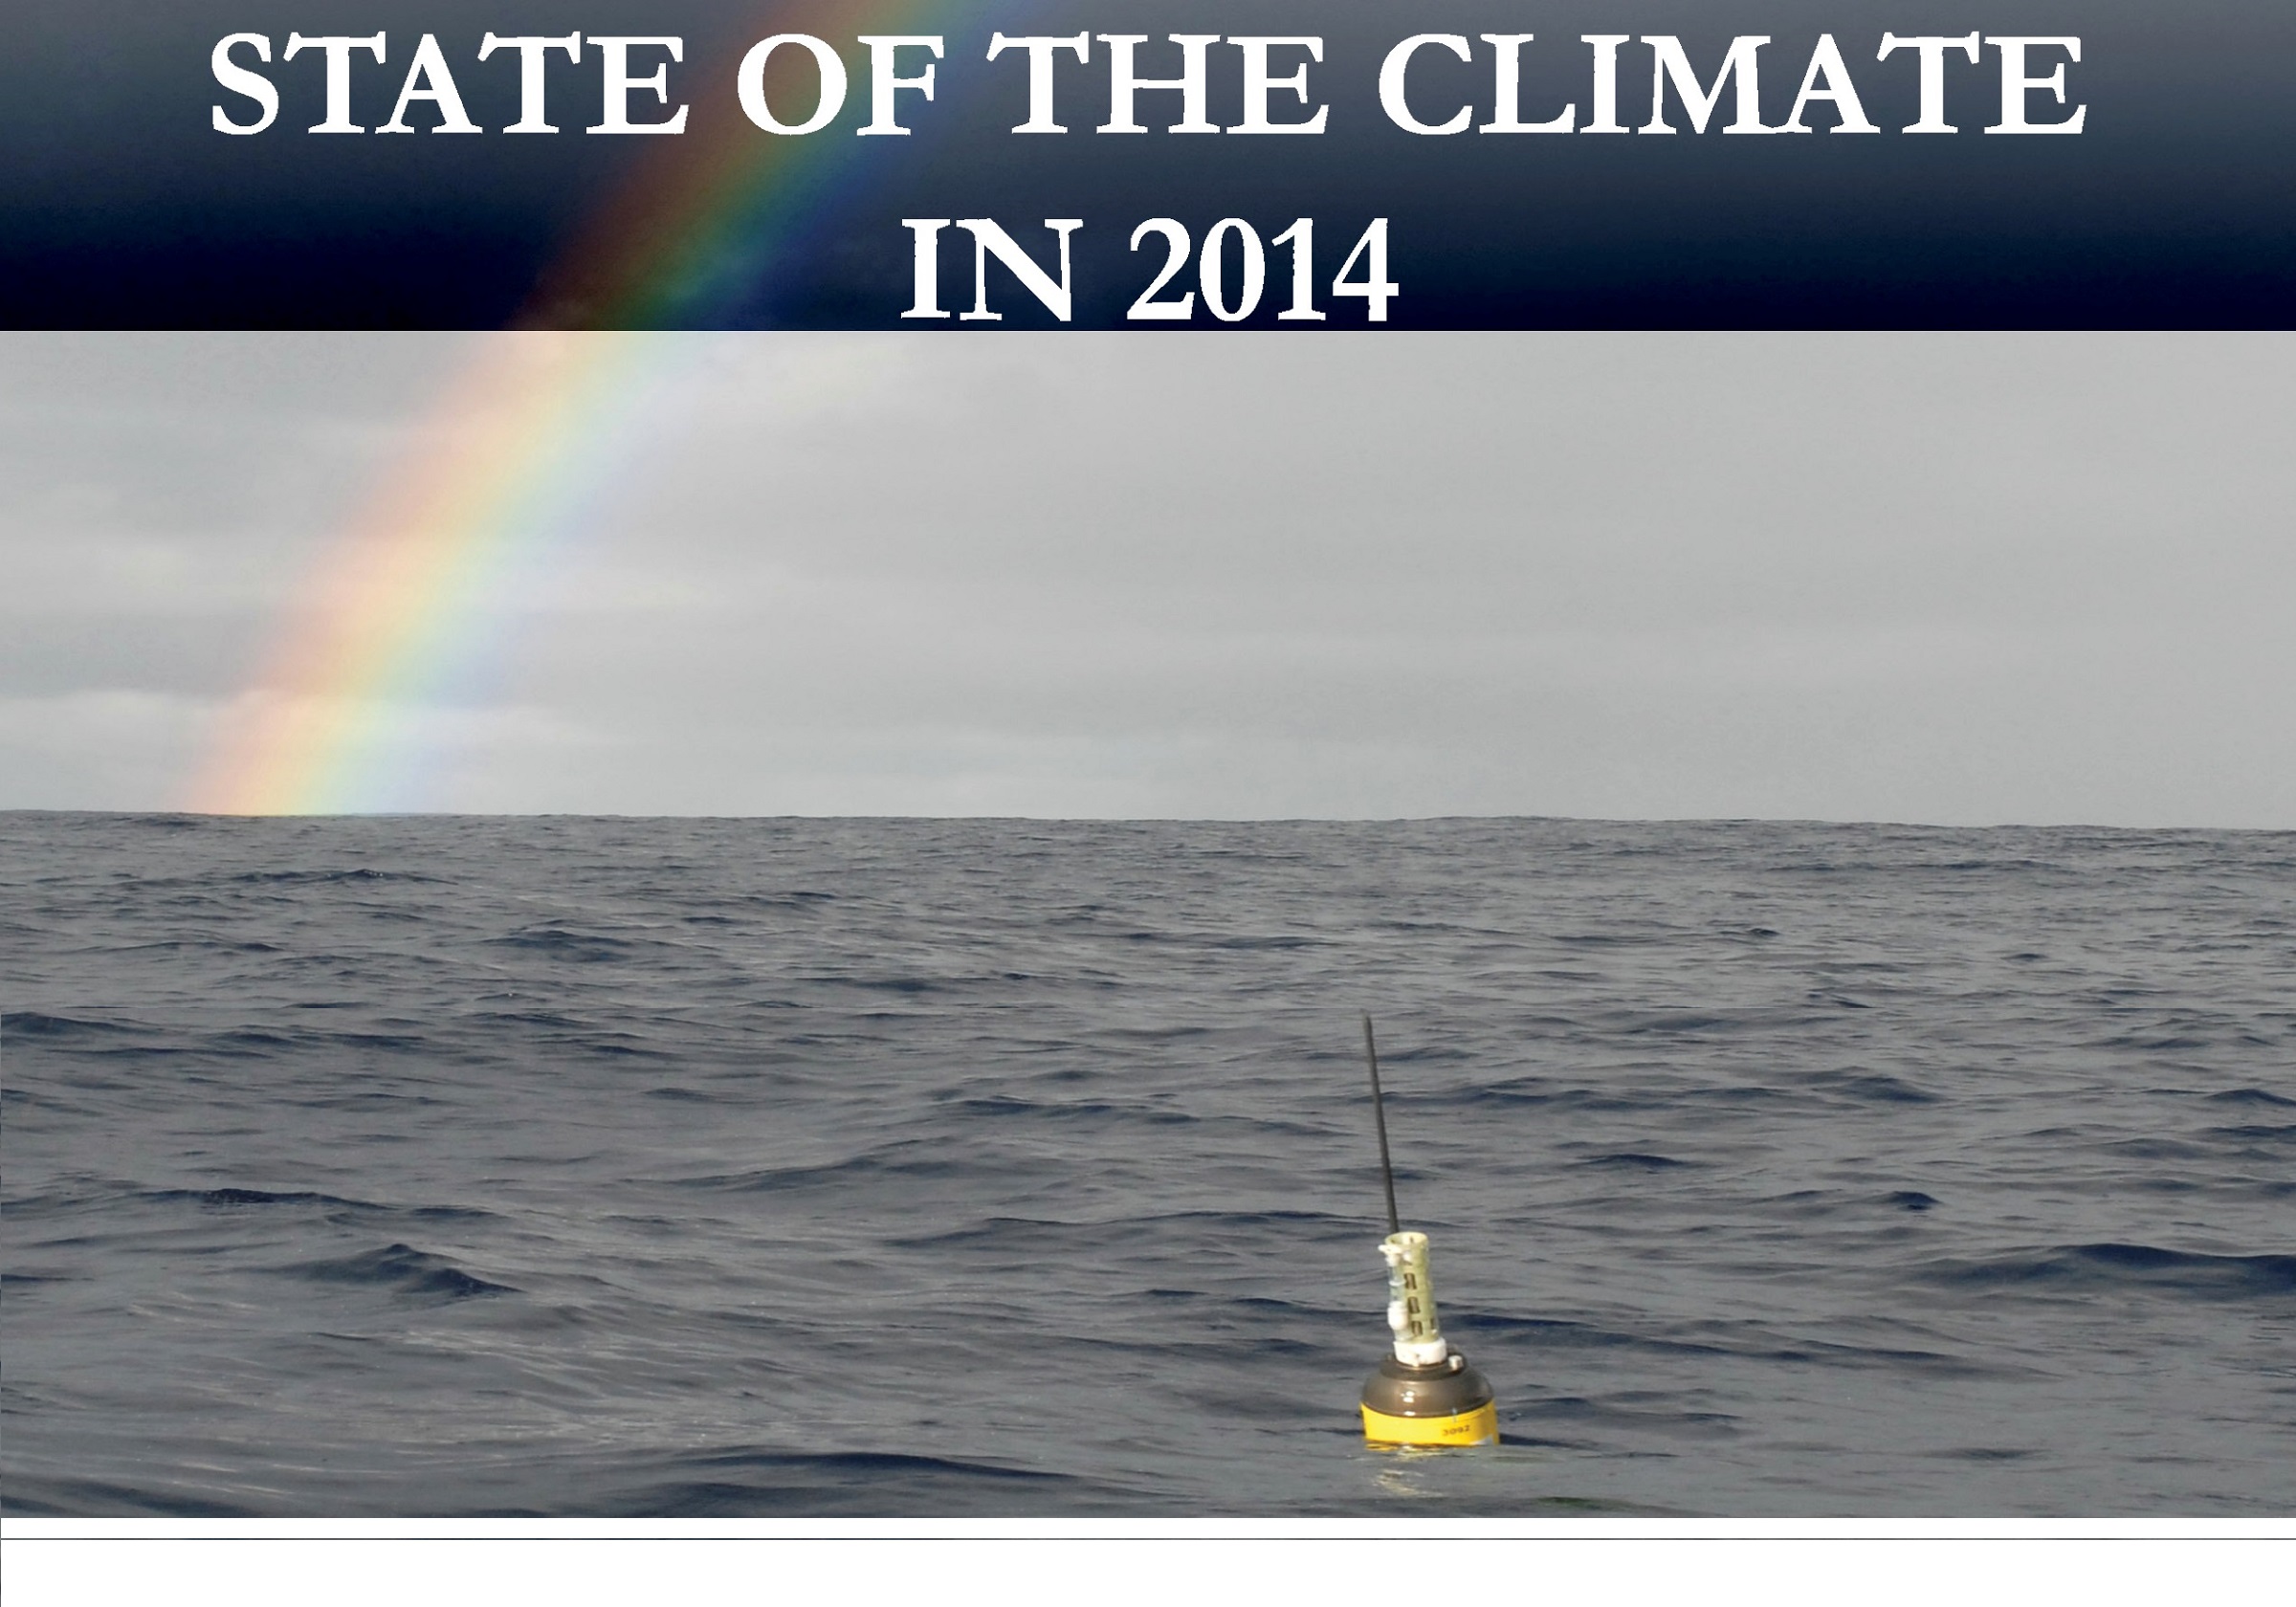
An Argo float on the cover of the State of the Climate in 2014.
The State of the Climate in 2014 report, published in July 2015 as a Bulletin of the American Meteorological Society supplement, highlights records in sea level, ocean heat content, and sea surface temperature, also documenting ocean climate variability including the borderline El Niño, the warm-water “Blob” in the Northeast Pacific, and a transition to the warm phase of the Pacific Decadal Oscillation. The cover features a PMEL Argo float, deployed in September 2007 and still active in July 2015. PMEL scientist Gregory Johnson co-edited the Global Oceans chapter of the report, composing haiku to summarize 2014 ocean variations:
Not quite El Niño, | North Oceans’ fluxes, warmth shift, | dance with weird weather.
and longer-term changes:
Seas warm, ice caps melt, | waters rise, sour, rains shift salt, | unceasing, worldwide.
Several PMEL, JISAO, and JIMAR scientists are section authors.
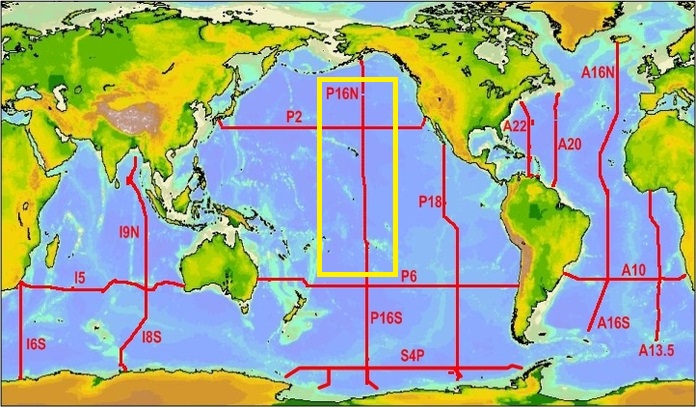
Cruise track for P16N outlined in yellow.
From April–June 2015, scientists on the NOAA ship Ronald H. Brown are collecting observations of Pacific Ocean water properties and currents from Tahiti to Alaska. This expedition is part of the US GO-SHIP Repeat Hydrography Program, an international effort to measure and observe the changing global ocean every decade. This particular cruise fortuitously crossed the equator during a developing El Niño and shortly after a transition to the warm phase of the Pacific Decadal Oscillation, allowing study of how these climate variations affect ocean conditions such as biological production and heat transport.
Read more about the US GO-SHIP program, leg 1 and leg 2 cruise blogs, the PMEL Carbon Program Repeat Hydrography page, the Large-Scale Ocean Physics page, and the Ocean Tracer group.
An El Niño in the equatorial Pacific is expected to play a dominant role in the winter weather for the U.S. Temperatures are expected to be warmer than average across most of the western and central U.S. with cooler than average temperatures in the Southeast and mid-Atlantic states.
For more information on how PMEL helps detect El Niños please visit the NOAA El Niño web site.
In an article recently published in Geophysical Research Letters, Tong Lee of the Jet Propulsion Lab in Pasedena and Mike McPhaden of PMEL analyzed 30 years of NOAA satellite sea surface temperature data and found that the intensity of El Niño events in the central equatorial Pacific has almost doubled in the past three decades, with the strongest warming in 2009-10.
These “central Pacific” (CP) El Niño’s exhibit maximum warming in the central equatorial Pacific in contrast to the classical El Niños, which have maximum warming in the eastern equatorial Pacific.
PMEL’s Dr. Ed Harrison and JISAO’s Dr. Andy Chiodi co-authored a paper published online on February 7 in the Journal of Climate that finds a new way to identify which El Niño events will have the biggest impact on U.S. winter weather. They examined an indicator known as outgoing long-wave radiation (OLR) and found that El Niño events with drops in OLR were most likely to be associated with winter weather.
For more information please read the NOAA press release.
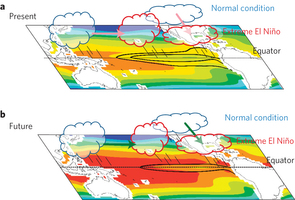
In both present-day climate (a) and future climate (b), convection zones in the western Pacific and the ITCZ latitudes shift from their normal positions (blue clouds) to the equatorial Pacific during an extreme El Niño event (red clouds).
For the first time, in a research article published January 19 in Nature Climate Change, PMEL’s Dr. Michael McPhaden and a team of international scientists provide robust and convincing evidence that greenhouse warming will double the chance of extreme El Niño events in the coming decades. The scientists examined 20 climate models and found a doubling of extreme El Niño events, like the one in 1997-98, from present-day through the next 100 years in response to greenhouse warming.
For more information on El Niño, please visit the Tropical Atmosphere Ocean project website.