About the Global Display
On the Google Map
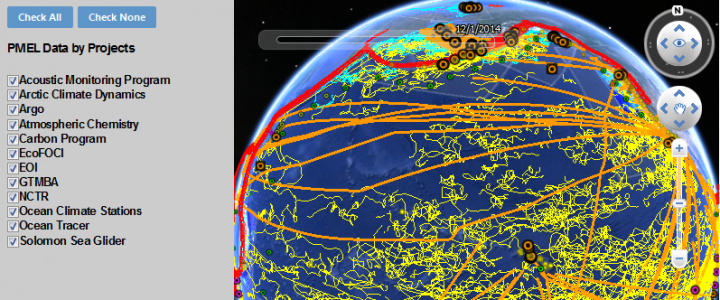
The locations where PMEL has collected observational data are shown on a Google map. Display layers can be clicked on and off by using the primary buttons on the left to select by PMEL Project . Clicking on a data observation location or icon on the globe will open a window with information about the observation, including links to the project and the data.
Data Links
Alternatively, the Data Links web page allows you to link directly to datasets on project websites.
On Google Earth
You can download the PMEL Metadata KMZ files for display in Google Earth for Desktop (by Project Type, PMEL Theme, By Year and Survey Type). Display layers can be clicked on and off by using the primary buttons on the left to select by PMEL Project, PMEL Theme, Year or Survey type and then selecting layers/observations to be displayed from the panel to the left of the globe (see the legend). Once the data display has loaded on the globe, clicking on a data observation location or icon on the globe will open a window with information about the observation, including links to the project and the data. Close the balloon by clicking elsewhere on the globe. The time range for data displayed is controlled with the time slider above the globe. To improve the performance, try turning off large layers (e.g., Argo floats or EcoFOCI) when they are not needed.
- PMEL Project refers to the PMEL research projects
- PMEL Theme refers to the themes in the PMEL Strategic Plan (Climate-Weather Research, Marine Ecosystem Research, Oceans and Coastal Processes Research, and Research Innovation)
- Survey Type refers to the method or type of data collection (moored buoys, station data, track-line data and study areas, shown in the legend)
Disclaimer: This is a prototype website. If the map isn't working properly, you can find the data by using the Data Links web page. Issues can be reported by sending email to the PMEL webmaster.

Click above to see the legend for the global display of PMEL metadata in Google Earth.


