


Figure_SoC_sm.png
Image
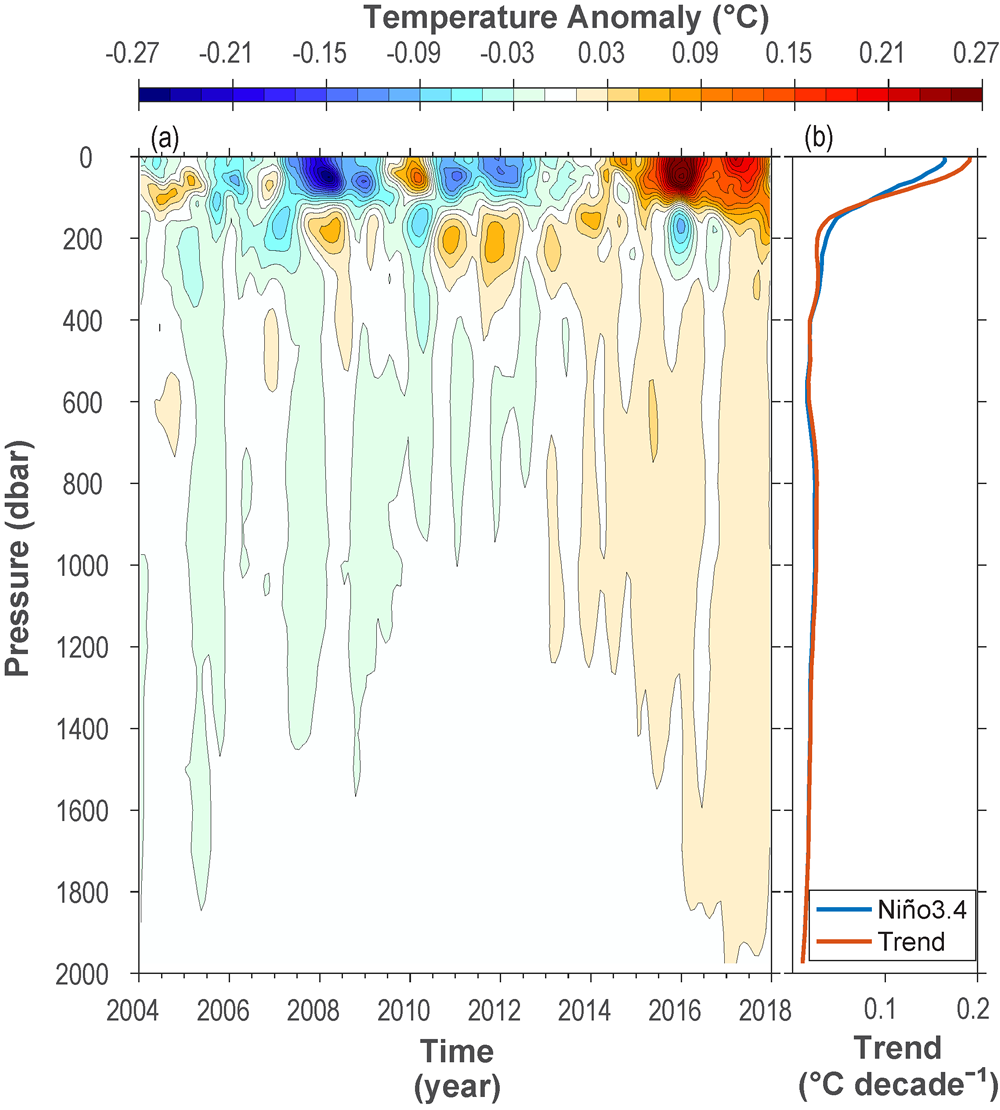
Ocean temperature anomalies. (a) Near-global integrals of ocean temperature anomalies relative to the record-length average seasonal cycle updated from Roemmich and Gilson (2009). (b) Linear trend of temperature anomalies (orange line), and trend with a Niño3.4 regression removed (blue line) following Johnson and Birnbaum (2017).