What's New Archive
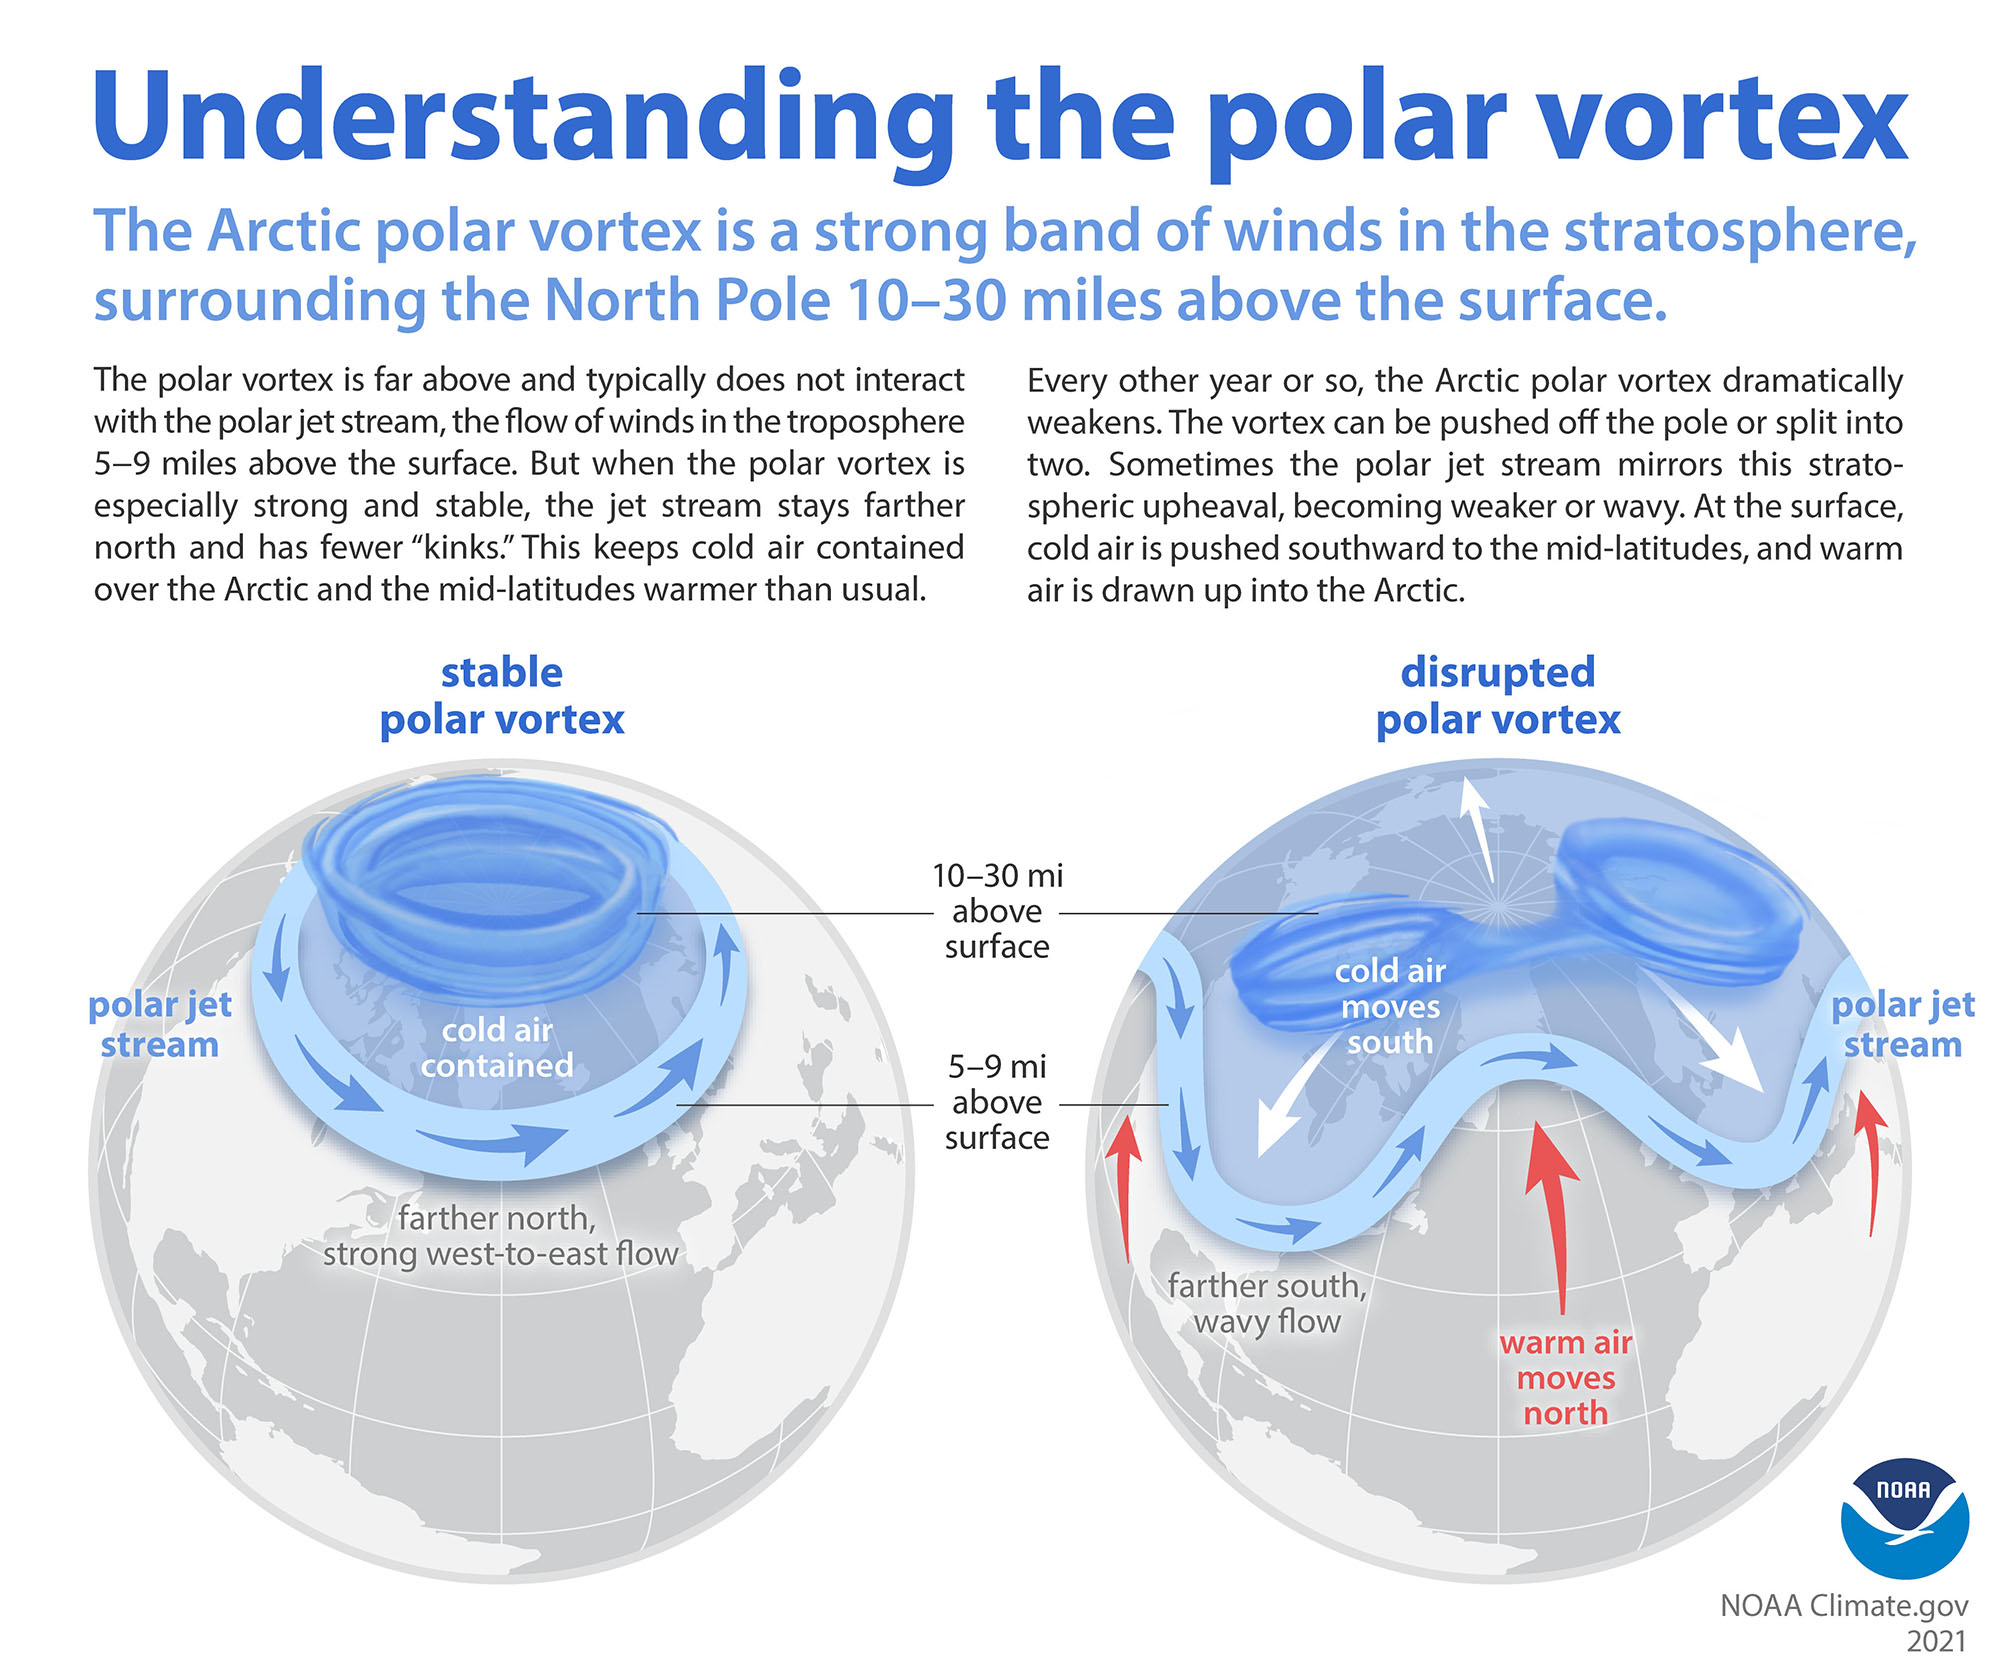
Click image to see full graphic (Source: NOAA Climate.gov)
Despite rapid Arctic warming, plan for more frigid spells
New research on the Arctic confirms that even as the Arctic is warming faster than the rest of the world, cold-air outbreaks from the polar region will continue across the Northern Hemisphere in the coming decades.
The big challenge now is to better understand what triggers these cold-air outbreak events and how to improve their predictability.
Much of the previous research has shown how a weakening of the stratospheric polar vortex can allow pockets of frigid air to plunge much farther south than normal. The new study, conducted by an international team including Arctic researchers from NOAA, provides additional insights as to how other influences - stalled weather systems, stretching of the stratospheric polar vortex and even events in the distant midlatitudes can influence these polar patterns.
"A better understanding of these Arctic-midlatitude linkages would improve forecasts covering periods of weeks to months, which would give communities more time to plan for adverse winter weather conditions," said co-author Muyin Wang, a scientist from the Cooperative Institute for Climate, Ocean, and Ecosystem Studies who works at NOAA’s Pacific Marine Environmental Laboratory (PMEL). "The impacts can be more significant as societies conditioned to global warming become increasingly less used to them."
The study was published in Environmental Research: Climate.
The stratospheric polar vortex is a mass of cold whirling air bounded by the jet stream that forms 10 to 30 miles above the Arctic surface in response to the large north-south temperature difference that develops during winter. Generally, the stronger the winds, the more the air inside is isolated from lower latitudes, and the colder it gets. But sometimes it can be shifted or stretched off the pole toward the United States, Europe or Asia.
"It seems really counterintuitive, but there will be plenty of ice, snow, and frigid air in the Arctic winter for decades to come, and that cold can be displaced southward into heavily populated regions by Arctic heat waves," said co-author Jennifer Francis with the Woodwell Climate Research Center.
The study, which resulted from an international workshop held in 2023 in Great Britain, provides a new analysis of recent research that offers a pathway to improved forecasts.
The authors said the stratospheric polar vortex has been relatively under-studied in previous reviews of Arctic-midlatitude climate linkages that focus predominantly on the role of changes in the tropospheric polar jet stream. They suggest that future research should focus on the complicated interactions between Arctic, midlatitude and tropical influences.
While many analyses focus on warm Arctic and cold midlatitude events, connections have also been found between unusually cold Arctic temperatures and warm winter events in midlatitudes, especially in Europe.
"Such a range of results confounds those who would like the science to offer a simple way to anticipate seasonal outlooks," said James Overland, a research oceanographer at PMEL.
One of the complicating factors occurs when a weather system stalls, creating an atmospheric block: a quasi-stationary modification of the jet-stream flow that occurs at middle and high latitudes and typically last for one to a few weeks. Blocking events are associated with persistent weather conditions in the vicinity of the block and frequently lead to extreme weather events in midlatitudes, including winter cold air outbreaks.
Tropical climatic drivers, such as the El Niño-Southern Oscillation and the Madden-Julian Oscillation, can create the conditions that lead to the establishment of these atmospheric blocks thousands of miles away.
The study authors underscored the need for research to better understand how to predict cold outbreaks in lower latitudes, which will help communities adapt to the consequences of extreme cold weather.
"The Arctic may seem irrelevant and far away to most folks, but our findings show that the profound changes there affect billions of people around the Northern Hemisphere," said lead author Edward Hanna with the University of Lincoln.
The international research team was composed of scientists from the United States, United Kingdom, Germany, Finland, South Korea, China and Japan.
"The most interesting part of the research is that the polar vortex stretching events could be an important driver of North American cold air outbreaks,” said Amy Butler, a climate researcher with the Chemical Sciences Laboratory who was not involved in the study. “It’s a novel way of looking at how the stratosphere might influence the surface climate - It’s certainly worth understanding better to improve predictability."
(Material from University of Lincoln and Woodwell Institute press releases were included in this story.)
Hanna, E., J. Francis, M. Wang, J.E. Overland, J. Cohen, D. Luo, T. Vihma, Q. Fu, R.J. Hall, R. Jaiser, S.-J. Kim, R. Köhler, L. Luu, X. Shen, I. Erner, J. Ukita, Y. Yao, K. Ye, H. Choi, and N. Skific (2024): Influence of high-latitude blocking and the northern stratospheric polar vortex on cold-air outbreaks under Arctic amplification of global warming. Environ. Res. Clim., 3(4), 042004, doi: 10.1088/2752-5295/ad93f3
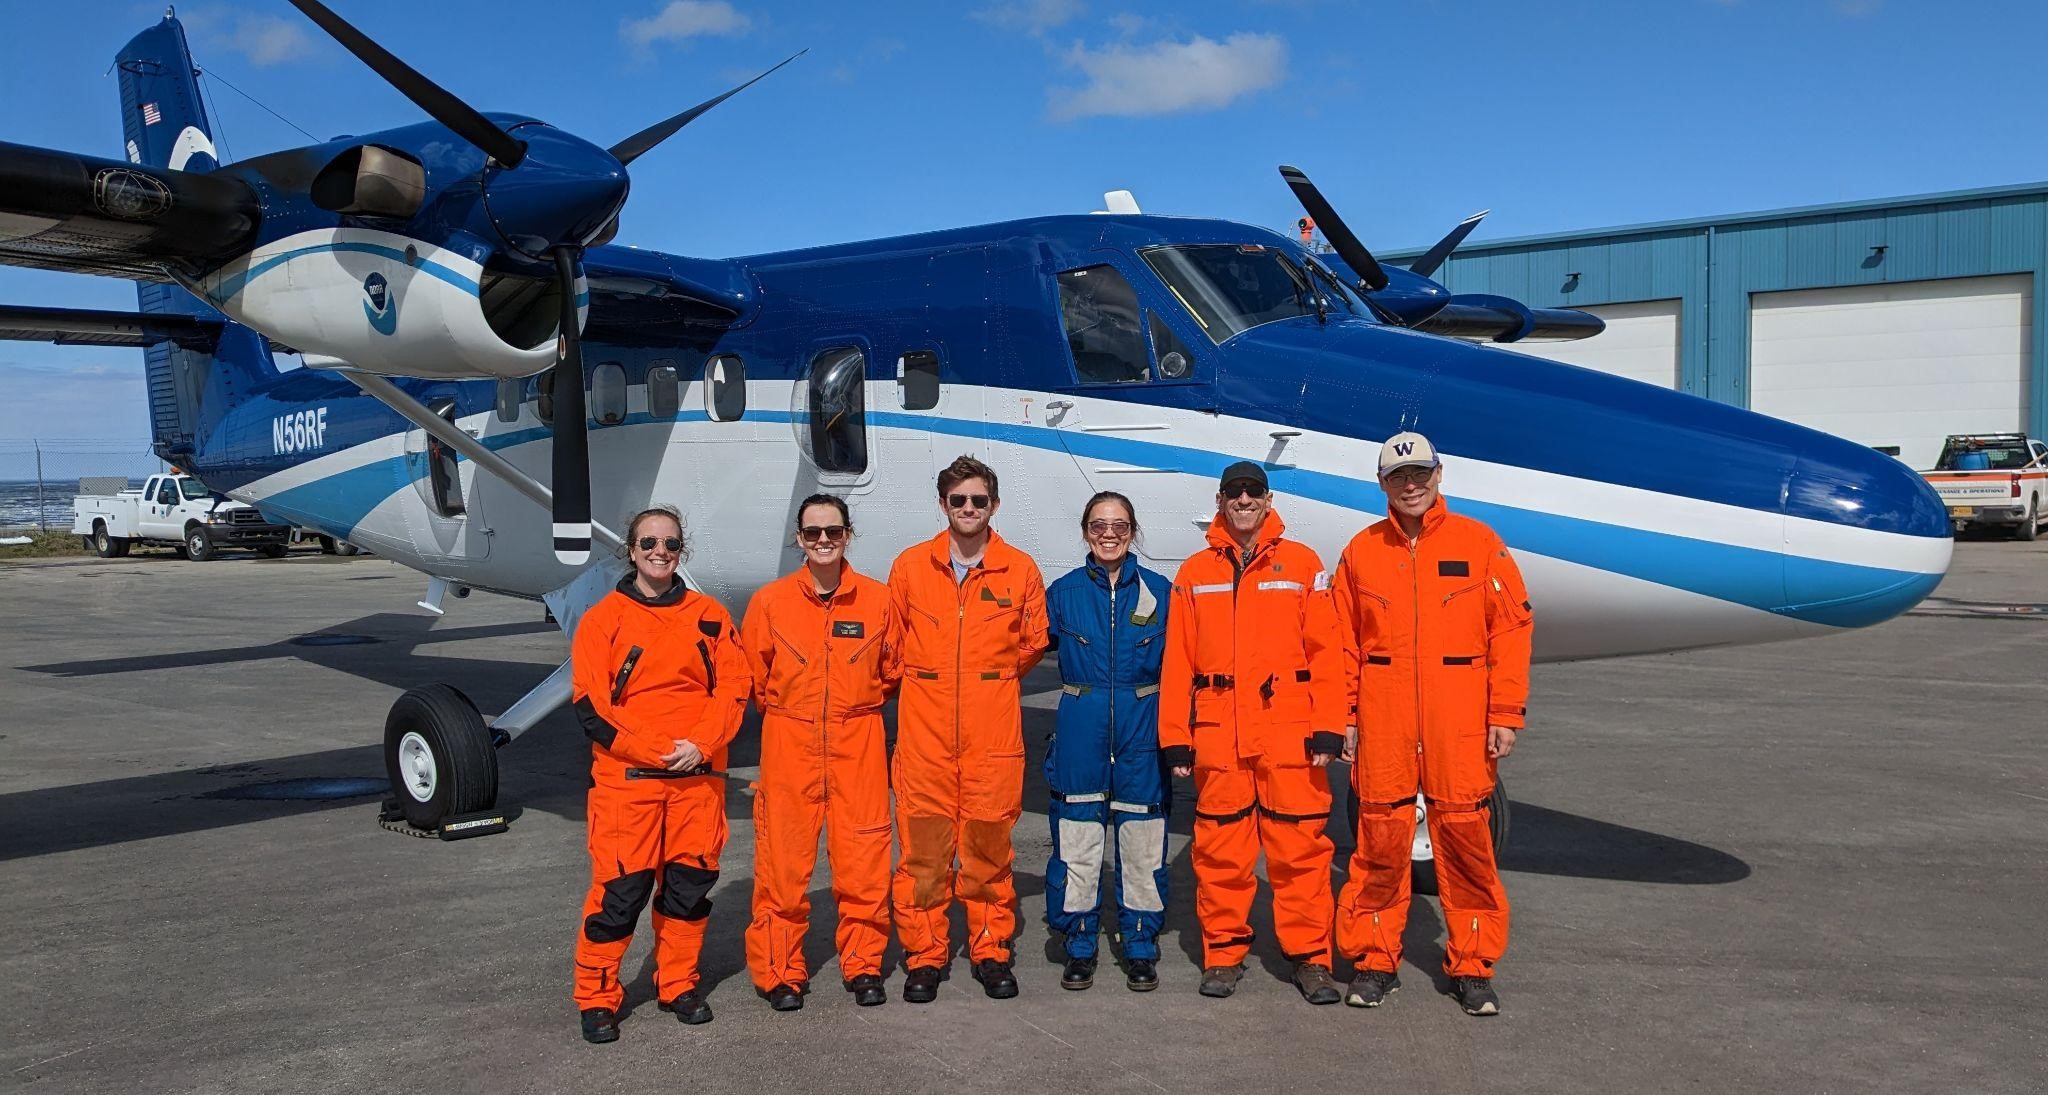
The 2023 June Arctic Airborne Investigations and Research crew consisted of staff from NOAA's Pacific Marine Environmental Laboratory, NOAA Office of Marine and Aviation Operations and University of Washington. They flew over the Southern and Central Chukchi Sea and coordinated overflights with R/V Sikuliaq.
From left to right: Denise Miller (OMAO), Sarah Cozart (OMAO), Nicholas Underwood (OMAO), Jiaxu Zhang (UW/CICOES and NOAA PMEL), Michael Steele (UW/APL), and Zheng Liu (UW/APL). Photo credit: Brent Schoumaker (OMAO)
NOAA and partner scientists recently completed two successful field tests in the US Arctic merging new technologies and traditional ship surveys to assess real-time phytoplankton species distributions in response to surface warming.
The rapid warming of the Arctic Ocean has led to earlier sea ice retreats in spring and later arrivals in fall. This shift has prompted significant changes in phytoplankton communities, which is a critical measurement to understand ecosystem health.
In June 2023, 60 nautical miles of flights were coordinated with a research ship operating in the survey region to use a multispectral camera, the first of its kind. This provided an opportunity for scientists to distinguish phytoplankton species and physical characteristics in the Chukchi Sea.
The team from NOAA and the University of Washington tested a cutting-edge imaging system, to observe distributions of phytoplankton from the NOAA Twin Otter using a hyperspectral camera. The camera uses a sensor that takes many pixelated images that translate to an absorption spectrum based on the colors the phytoplankton reflects. The hyperspectral camera uses reflectiveness of the ocean to identify species and how much area they cover. It can be used to identify phytoplankton groups based on their pigment information. This emerging research method alongside the upcoming launch of the NASA PACE satellite may allow scientists to assess biodiversity in the ocean and in food webs and detect water quality issues such as harmful algal blooms (HABs).
This September 2023, additional flights were coordinated with the NOAA Arctic & Ecosystem Research Cruise on the R/V Sikuliaq to enable comparisons between the aircraft and ocean measurements. Adding in hyperspectral data provides a trifecta of sources to support monitoring of phytoplankton in the region. Satellite imagery can detect possible algal blooms, and ship-based samples can capture images in which species can be identified.
The combination of these technologies may provide the groundwork for the monitoring and managing of algal blooms in the US Arctic.
A typhoon, smoke from wildfires and increasing rain are not what most imagine when thinking of the Arctic. Yet these are some of the climate-driven events included in NOAA’s 2022 Arctic Report Card, which provides a detailed picture of how warming is reshaping the once reliably frozen, snow-covered region which is heating up faster than any other part of the world.
This year’s Arctic Report Card also features the most comprehensive chapter in the annual report’s 17-year history about how these dramatic environmental changes are felt by Arctic Indigenous people, and how their communities are addressing the changes. Additionally, a chapter on precipitation has been added reflecting an improvement in available data and showing the dramatic increase in precipitation across the Arctic in recent decades.
Surface Air Temperature
PMEL Arctic researcher's Dr. James Overland and Dr. Muyin Wang contributed to sections on surface air temperature. Arctic annual air temperatures from October 2021 to September 2022 were the sixth warmest dating back to 1900, continuing a decades-long trend in which Arctic air temperatures have warmed faster than the global average. The Arctic's seven warmest years since 1900 have been the last seven years.
Winter temperatures in the Eurasian Arctic and Arctic Ocean were above normal, while winter temperatures over most of North America were below-normal.
An extensive region of low pressure in the eastern Arctic supported warm Eurasian and Arctic Ocean winter temperatures, while low pressure across the Alaska Arctic and northern Canada sustained warm summer temperatures over the Beaufort Sea and Canadian Archipelago.
About the Report Card
The report card is compiled by 147 experts from 11 nations and includes three sections: Vital Signs, Indicators and Frostbites. Vital Signs provide annual updates on key topics. Indicators explore topics that are periodically updated, and Frostbites report on new and emerging issues.
View the visual highlights or recorded AGU Press Conference.
Modified from the original NOAA Press Release.
NOAA’s 2021 Arctic Report Card, released today at the American Geophysical Union’s Fall Meeting, documents the numerous ways that climate change continues to fundamentally alter this once reliably-frozen region, as increasing heat and the loss of ice drive its transformation into a warmer, less frozen, and more uncertain future.
The Arctic continues to warm more than twice as fast as the rest of the globe. The October-December 2020 period was the warmest Arctic autumn on record dating back to 1900. The average surface air temperature over the Arctic this past year (October 2020-September 2021) was the 7th warmest on record.
The total extent of sea ice in September 2021 was the 12th lowest on record. All 15 of the lowest minimum extents have occurred in the last 15 years. The substantial decline in Arctic ice extent since 1979 is one of the most iconic indicators of climate change.
Some of the fastest rates of ocean acidification around the world have been observed in the Arctic Ocean. Two recent studies indicate a high occurrence of severe dissolution of shells in natural populations of sea snails, an important forage species, in the Bering Sea and Amundsen Gulf.
The Arctic Report Card is an original, peer-reviewed environmental observations and analysis that documents rapid and dramatic shifts in weather, climate, terrestrial and oceanic conditions in the circumpolar region. This year’s report was compiled by 111 scientists from 12 nations. PMEL and UW Cooperative Institute scientists contributed to sections on surface air temperature (Dr. James Overland, Dr. Muyin Wang), sea ice (Dr. Kevin Wood) and on ocean acidification (Dr. Jessica Cross, Dr. Darren Pilcher).
Check out the visual highlights and more details of the full Arctic Report Card.
Read the original NOAA Press Release and the recorded AGU Press Conference.
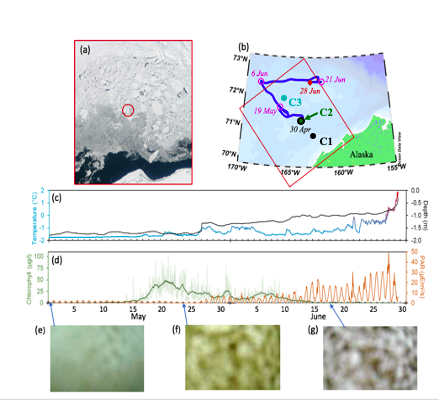
During the first Chukchi deployment, floats resurfaced under a sheet of floating ice (ice floe), monitored and tracked the ice region for almost two months and detected an under-ice algae bloom (Stabeno et. al, 2020). The bottom row shows the captured images with no bloom and/or algae.
After spending 8 months under water and ice, two of NOAA’s three Arctic-deployed pop-up floats have successfully surfaced in the Chukchi Sea and are transmitting data on temperature, pressure, photosynthetic active radiation (PAR), and chlorophyll fluorescence. These data are from measurements taken while the float is anchored to the seafloor, while it rises through the water column, and while it is trapped under the ice at the water-ice boundary.
The two floats were initially deployed in the fall of 2020 by the scientists and crew of NOAA Ship Oscar Dyson. These are part of the 4th cohort of deployments since 2017, and the second cohort deployed in the Chukchi Sea. The first float to surface has transmitted data from the four months it spent on the seafloor, just over a month of data from when it was trapped under ice, and about half of the photos it took while under ice. The second float has transmitted about five months of data from the seafloor, just over four months of data from under the ice along with the under-ice photos it captured, and 7 days of open ocean sea surface temperature.
Pop-up floats provide an inexpensive method to explore a unique micro-ecosystem under floating ice. The floats collect ocean health data to help researchers better understand the rapidly changing Arctic ecosystem. They collect data during the ice-covered winter and spring months, a time during which it isn’t possible for researchers to penetrate the ice from above to study the water underneath. The water column data they collect on their rise up from seafloor to surface is essential for researchers to monitor ongoing ecosystem changes in the Arctic, such as watching for harmful algal blooms and documenting biodiversity in the environment. The floats can also help researchers measure the extent of the cold pool, an area of cold water about 30 meters deep that results from melting Arctic ice from the previous season.
NOAA PMEL began development of these floats in 2015. The float is an orange sphere equipped with sensors to measure temperature, pressure, and other ocean conditions as well as cameras to capture under ice imagery. It is deployed during the ice-free summer months and anchors to the seafloor measuring bottom-ocean conditions. It stays here collecting measurements throughout the winter and early spring. It then rises up through the water column at a pre-programmed time, in this case early March to mid-April, capturing data at various depths to create a profile of the water column. The floats are then trapped under ice when it reaches the surface, and will continue collecting data and images of conditions at the water-ice boundary. When the ice melts in mid-May and early June, the floats can emerge fully from the ice to reach the surface and begin transmitting their stored data, while continuing to monitor sea surface temperature.
Read more about the 2020 pop-up deployments in Arctic Today and on the ITAE website.
2020 Arctic Report Card Released: 15 years of observations document impact of changing polar climate
NOAA’s 15th Arctic Report Card catalogs for 2020 the numerous ways that climate change continues to disrupt the polar region, with second-highest air temperatures and second-lowest summer sea ice driving a cascade of impacts, including the loss of snow and extraordinary wildfires in northern Russia. The sustained transformation to a warmer, less frozen and biologically changed Arctic remains clear.
The average annual land-surface air temperature in the Arctic measured between October 2019 and September 2020 was the second-warmest since record-keeping began in 1900, and was responsible for driving a cascade of impacts across Arctic ecosystems during the year. Nine of the past 10 years saw air temperatures at least 1 degree C above (2.2 degrees F) the 1981-2010 mean. Arctic temperatures for the past six years have all exceeded previous records.Record warm temperatures in the Eurasian Arctic were associated with extreme conditions in the ocean and on the land.
Sea ice loss in spring 2020 was particularly early in the East Siberian Sea and Laptev Sea regions, setting new record lows in the Laptev Sea for June. The end of summer sea ice extent in 2020 was the second lowest in the 42-year satellite record, with 2012 being the record minimum year. Overall thickness of the sea ice cover is also decreasing as Arctic ice has transformed from an older, thicker, and stronger ice mass to a younger, thinner more fragile ice mass in the past decade.
PMEL’s Dr. James Overland, Dr. Muyin Wang (UW/CICOES), and Dr. Kevin Wood (UW/CICOES) contributed to sections on surface air temperature and sea ice. Dr. Overland is one of three founding editors of the Arctic Report Card and served as a co-editor from 2006 - 2017. Read the full interview about his work in the Arctic and with the Arctic Report Card.
The Arctic Report Card is an annual compilation of original, peer-reviewed environmental observations and analyses of a region undergoing rapid and dramatic alterations to weather, climate, oceanic, and land conditions. Compiled by 133 scientists from 15 countries, the 2020 report card tracks environmental indicators to inform decisions by local, state and federal leaders confronting a rapidly changing climate and ecosystems.
Check out the visual highlights and the full Arctic Report Card.
Read the original NOAA Press Release.
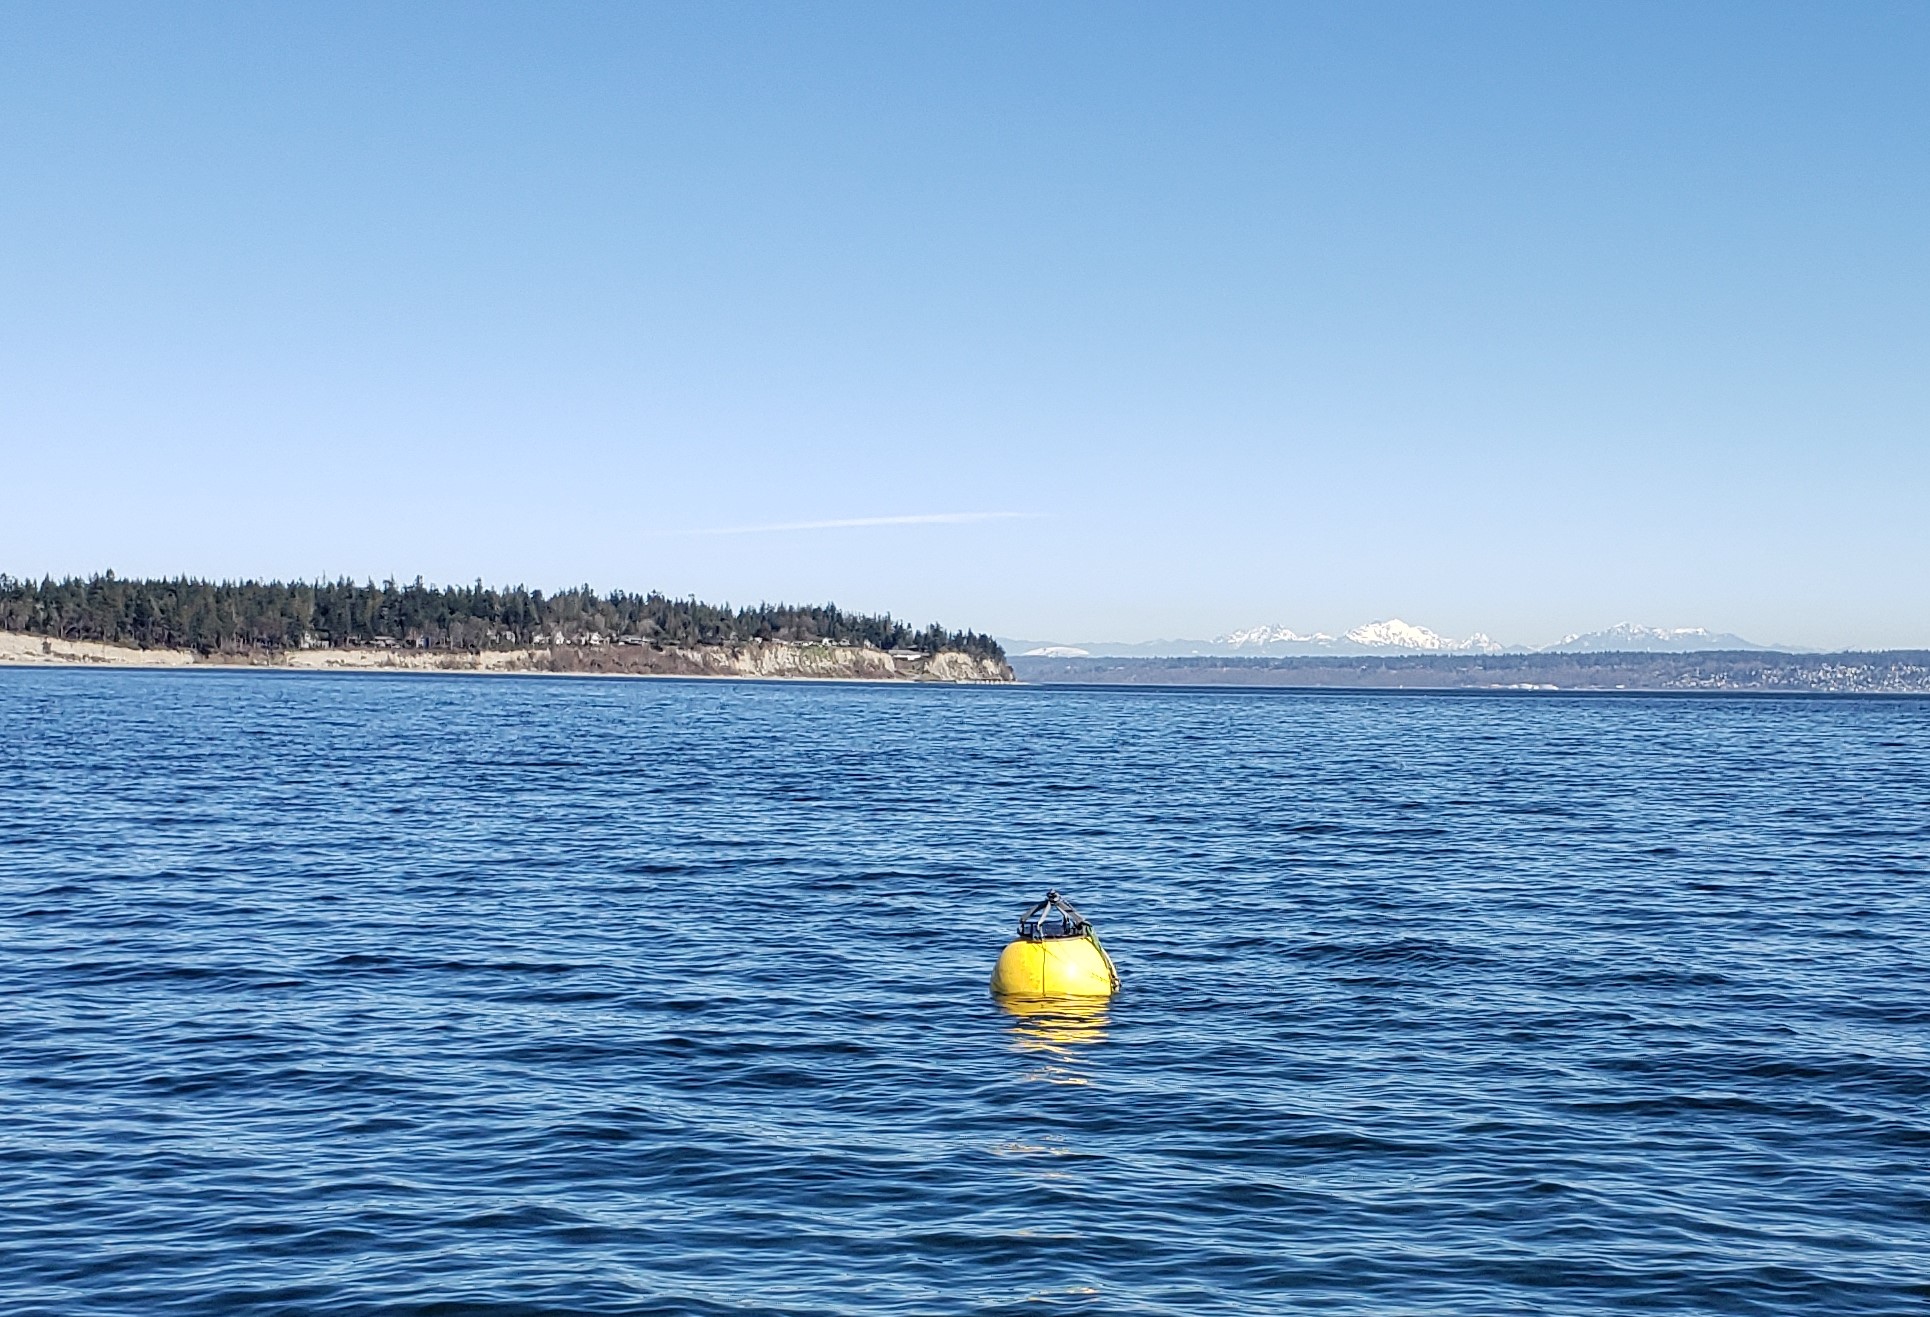
Flotation Controllable Ocean Mooring (FCOM) system resurfacing during testing in Puget Sound.
After 8 months of sitting on the seafloor, PMEL’s latest engineering development, the Flotation Controllable Ocean Mooring (FCOM) system successfully resurfaced in July. Over the last two years, PMEL has been developing a profiling mooring for use in Arctic regions that submerges when ice arrives in the fall and refloats in the spring after ice retreat. The FCOM system has a surface float that is anchored to the ocean floor, and includes a Prawler that moves up and down the mooring line collecting profiles of temperature, salinity, chlorophyll, and dissolved oxygen. This innovation will provide real-time information of the full water column during the entire open water (sea ice free) season.
The Chukchi Sea is an ice-driven system. Collecting data during the spring and fall is crucial for monitoring ecosystem production and generating ice forecasts. Data collection during spring and fall is difficult as there are few vessels in the region during those times, and moorings must be placed near the seafloor to avoid ice keels which prevents real time data return on the status of the full water column. Prior to FCOMs, surface floats could only sample for a short period because deployment and recovery were dependent upon the tight scheduling of research vessels. This mooring addresses these long-standing science gaps.
The mooring was originally deployed from the R/V Ocean Starr in spring of 2019 in the Chukchi Sea with pre-programmed dates to sink and resurface. It sank in October 2019, resurfaced in July 2020 and will be recovered in September. The next version of FCOM will be outfitted with a hydrophone and ice-detection algorithms so that it can resurface after ice retreats without having a pre-programmed date. Ultimately, the FCOM with a Prawler is intended to be integrated into NOAA’s Arctic observing system.
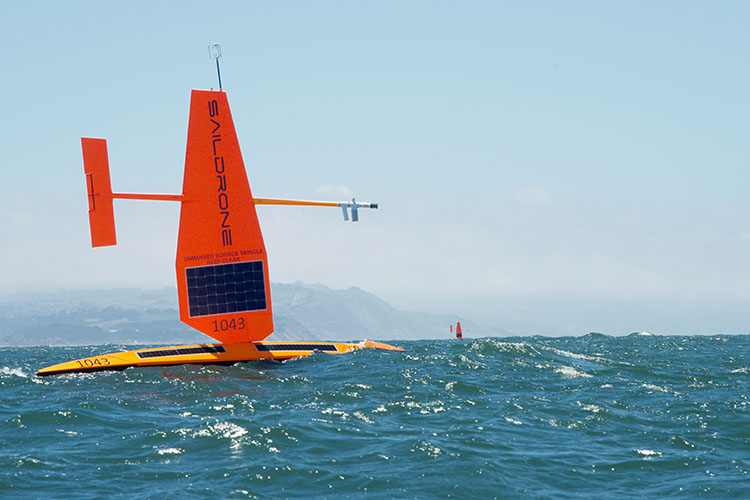
Two saildrones in the Pacific Ocean just west of the Golden Gate Bridge at the start of their journey. Photo Credit: Saildrone, Inc.
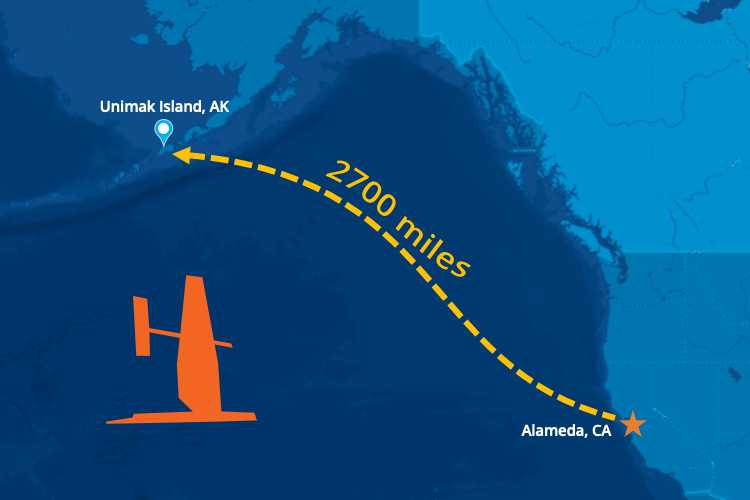
Three saildrones left Alameda, California in May and have arrived at Unimak Pass in Alaska’s remote Aleutian Islands to collect valuable abundance data to support sustainable management of the largest commercial fishery in the United States.
Three saildrones left Alameda, California in May and have arrived at Unimak Pass in Alaska’s remote Aleutian Islands. The ocean drones have sailed nearly 2,700 miles at a walking pace, about 2.5 miles per hour (2 knots), which is just about the distance from Seattle to Miami. Once they navigate through the pass, the saildrones will enter the Bering Sea. This is where they will conduct a two month-long acoustic survey of walleye pollock to collect some critically needed data to support management of the nation’s largest commercial fishery for Alaska pollock. They are expected to reach their first survey station in about a week and will cover roughly the same area normally covered by standard research vessels.
The data the drones collect will help to fill in the gap for fisheries stock assessment scientists who monitor the changes in pollock populations to advise fisheries management. The sonar measurements made by the ocean drones will provide valuable insights on pollock abundance and distribution in 2020.
The mission is led by NOAA's Alaska Fisheries Science Center with scientists at the Pacific Marine Environmental Laboratory processing the oceanographic and meteorological data in real time. Data will be made available to weather forecasts center worldwide via the World Meteorological Organization's Global Telecommunication System (GTS) so that these observations can be incorporated into weather predictions. PMEL, AFSC and Saildrone have collaborated on several missions in the Arctic since 2015 to develop the vehicle’s capabilities and refine the sensors.
PMEL, AFSC and Saildrone have collaborated on several missions in the Arctic since 2015 to develop the vehicle’s capabilities and refine the sensors.
The US Arctic and Bering Sea are big, remote, and harsh environments. PMEL's Innovative Technology for Arctic Exploration program and Engineering Development Division have been developing autonomous technologies and tools to collect critical data to better understand changes in the oceans and its impact on food security, sea ice forecasts, weather and climate.
Drones and gliders are not designed for ice edge and can offer a new perspective on Arctic science, exploring new areas of the Arctic Ocean. One critical area of study is the melting edge of the seasonal ice pack. The timing and speed of annual ice retreat is changing each year, and could have a big impact on ecosystems and global weather patterns. PMEL is pushing the envelope to further develop gliders and drones to advance the science near the ice edge to explore how it moves and changes.
Check out the video on our YouTube Channel to learn more about NOAA PMEL’s autonomous observing technology in the Arctic: https://youtu.be/A_