What changes have occurred in Arctic sea ice volume and dynamics over the past 50 years?
20th Century Changes
of the Arctic Sea Ice Cover
Also see Arctic Summer time: The puzzling summer of 2003
Dr. Norbert Untersteiner
Professor of Atmospheric Sciences
University of Washington
 |
|
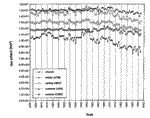
| Fig. 1 Time series of annual, winter (JFM), spring (AMJ), summer (JAS) and autumn (OND) mean northern hemisphere sea ice extent for the period 1901–1997. (From Walsh and Chapman, 2000). (updated here) |
Data collected by several countries bordering on the Arctic allow the construction of maps of the lateral sea ice extent since the beginning of the 20th century. Data from the first seven decades were derived from ship and aircraft observation while data for the last three decades come primarily from satellites. Figure 1 (from Walsh and Chapman, 2000) shows time series of the areas enclosed by the ice boundary (defined as having 10% or less of the surface of the ocean covered by ice).
During the first half-century, ice extent in all seasons remained essentially constant. Beginning about mid-century, the summer minimum extent began to shrink while the winter maximum remained unchanged. Starting in about 1975, the maximum, too, began to shrink. Ice extent in September 2000 (not shown in the plot) is only about 5x10⁶ km2, the smallest ever observed in this century.
Information about the average thickness of ice before the advent of nuclear submarines is limited to occasional samples taken from ships and manned ice camps. They suggest an average thickness of 3 to 3.5 meters and little change in time. Declassified submarine sonar observations of the ice draft taken between 1958 and 1976 corroborate this information. However, the unclassified cruises of the SCICEX program, 1993–199t show a significant, locally variable, thinning of the ice by 1–2 meters (Rothrock et al., 2000). It is likely that most of this thinning occurred in the last two decades of the century. These findings are supported by satellite-based passive microwave observations, which are capable of distinguishing first-year from multi-year ice, that the area fraction covered by my multi-year ice has shrunk by 14% between 1978 and 1998 (Johannessen et al., 1999).
The average thinning of the ice appears to be the result of both the diminished fraction of multi-year ice and the relative thinning of all ice categories.
Both the shrinking and thinning of the arctic sea ice cover appear to be in keeping with the poleward amplification of the global warming induced by increased greenhouse loading of the atmosphere and predicted by interactive climate models. Recent computations (e.g. Vinnikov, 1999) closely duplicate the observed reduction of the mean annual ice extent. However, closer inspection reveals a disturbing discrepancy: models show impacts in winter and observations show ice retreat in summer. As we expect from basic physical reasoning, the largest effects of greenhouse warming should be seen in the absence of solar radiation when thermal infrared radiation dominates the surface energy balance, i.e. in winter. The calculations by Vinnikov et al. (1999) and Manabe et al. (1992) indeed show the largest sea ice signal in winter. An explanation of this summer/winter discrepancy has not been offered so far. The absence and presence of sea ice, and its thickness, depend on very small differences between large fluxes of energy. Minor changes of the assumptions about surface albedo, snow cover, cloudiness and cloud radiative properties, ocean heat flux, and other factors, may have large effects on the computed ice cover and require a model precision that remains to be attained.
References and more Information
- Walsh, J.E and W.L. Chapman, 2000. Twentieth-century sea ice variations from observational data. Annals of Glaciology, vol.33 (accepted).
- Rothrock, D.D., Y. Yu, and G.A. Maykut, 1999. Thinning of the arctic sea ice cover. Geophys. Res. Letters, vol.26, p.3469–3472.
- Johannessen, O.M., E.V. Shalina, and M.W. Miles, 1999. Satellite evidence for an arctic sea ice cover in transformation. Science, vol.286, p.1937–1939.
- Vinnikov, K.Y, A. Robok, R.J. Stouffer, J.E. Walsh, C.L. Parkinson, D.J. Cavalieri, F.B. Mitchell, D. Garrett, and V.F. Zakharov, 1999. Global warming and northern hemisphere sea ice extent. Science, vol.286, p.1934–1937.
- Manabe, S., M.J. Spelman, and R.J. Stouffer, 1992. Transient response of a coupled ocean-atmosphere model to gradual changes of atmospheric CO2. Part II: Seasonal response. J.Climate, vol.5, p.105–126.
- Arctic Summer time: the puzzling summer of 2003
- Arctic Sea Ice Changes in Greenhouse Scenario Experiments, from GFDL
- Arctic modeling
- Sea Ice in the Bering Sea and the North Pacific Ocean
- Thinning of Arctic Ice Cover (from University of Washington APL)
Data
- Sea Ice Timeseries and data download from The Cryosphere Today (University of Illinois)


