
|
|
||
Climate Indicators - Surface Air Temperatures |
||||||
|
Arctic Oscillation | Surface Temperatures | Stratospheric Temperatures | Clouds | Ocean
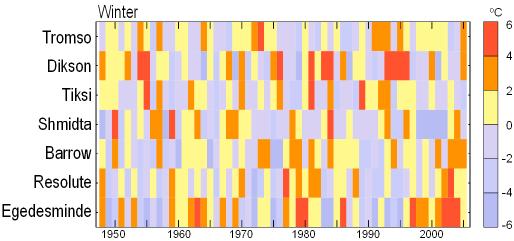
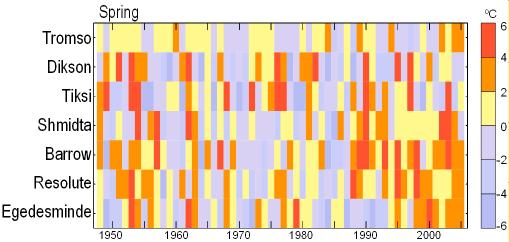
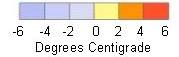
The figure below tracks temperature changes since 1950 at seven Arctic city weather stations for winter (December-January) and spring (April). The time axis for the plots runs from left to right and the temperature anomalies (difference from 1960-1990 mean) are shown as colors, with the values given by the color bar below the plot. Locations of the seven cities are shown on the map to the right and represent the major climate sub-regions of the Arctic. Notice the warm temperatures (orange colors) in the two plots below. Northern European winters (Tromso) were warm in the 1990's, with some cooler temperature in the last two years. The most dramatic winter changes are the warm temperatures (orange colors) after 2000 from eastern Siberia (Shmidta) eastward to west Greenland (Egedesminde). Siberia (Dikson and Verjojansk) had warm temperature in the 1980s, Dickson in the early 1980s and Verjojansk in the late 1980s. North American stations (Barrow, Resolute and Egedesminde) were also warm around the beginning of the 1980s. Western Arctic springtime was generally warm (orange colors) after 1987, with west Greenland (Egedesminde) joining the warming after 1993 and Tromso after 2001. There are some earlier events that are as warm as the 1990s, but these events are more localized in location and duration.
Find more information (references and websites):
|
||||||
| About | http://www.pmel.noaa.gov/arctic-zone/detect oar.pmel.arctic.webmaster@noaa.gov DOC | NOAA | PMEL | Arctic Zone | Arctic Change Detection Privacy Policy | Disclaimer |