
|
|
||
Climate Indicators - Stratospheric Air Temperatures |
|||||||||||||||||||||||||||||||||||||||||||||||||||||||||||
|
Arctic Oscillation | Surface Temperatures | Stratospheric Temperatures | Clouds | Ocean
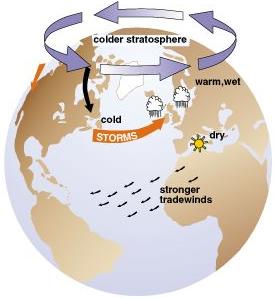
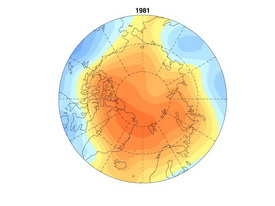
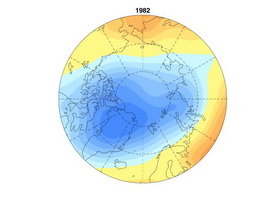
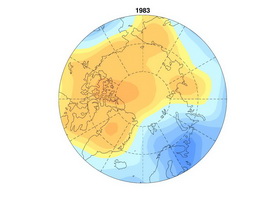
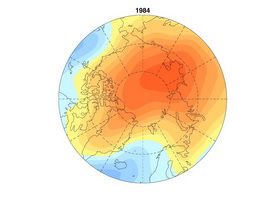
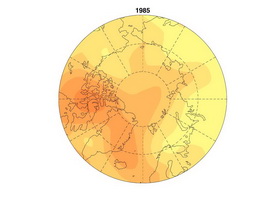
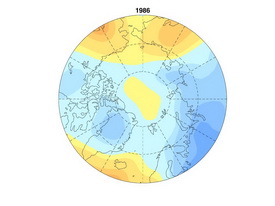
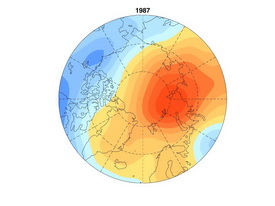
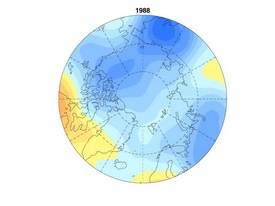
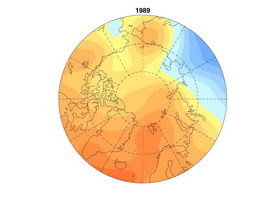
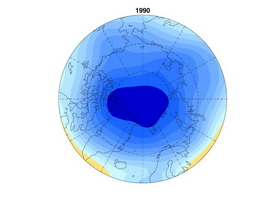
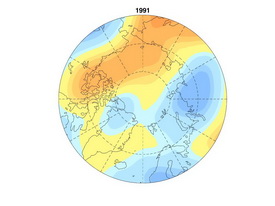
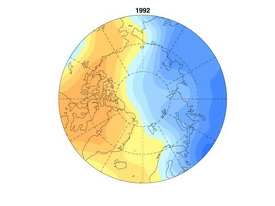
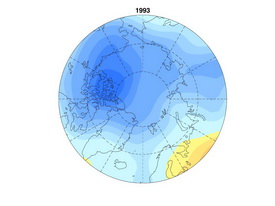
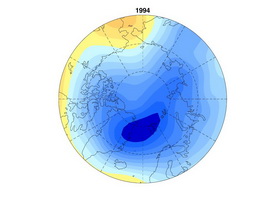
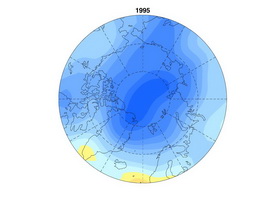
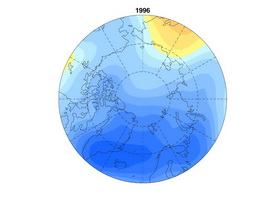
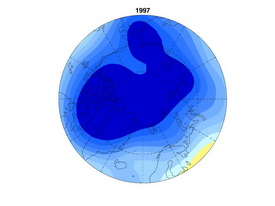
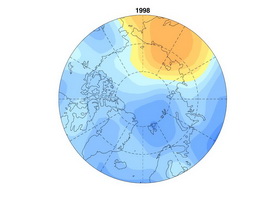
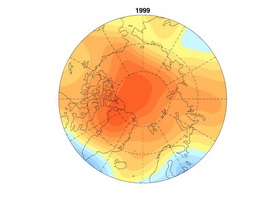
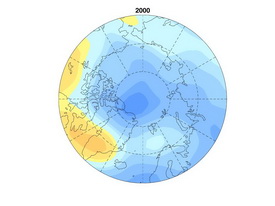
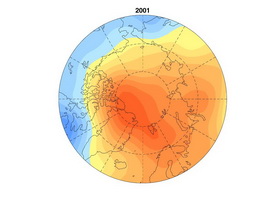
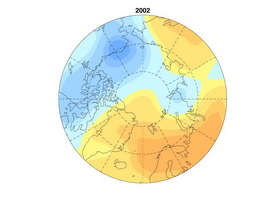
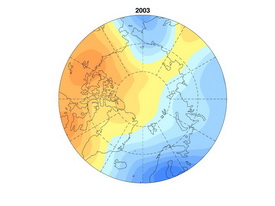
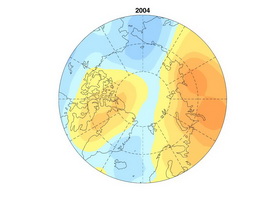
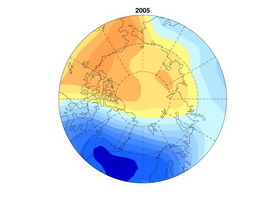
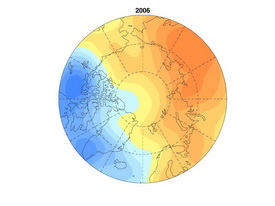
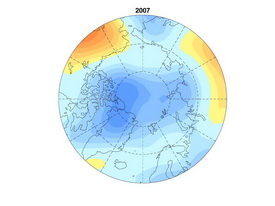
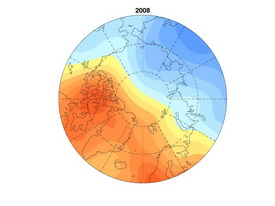
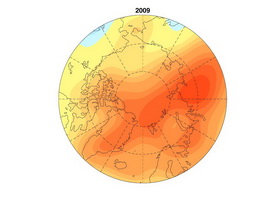
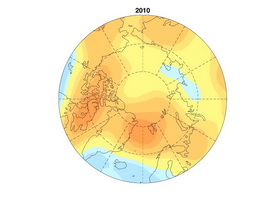
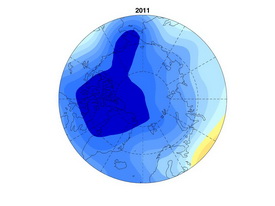
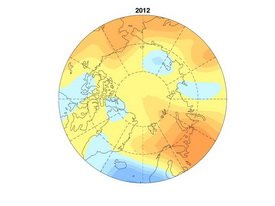
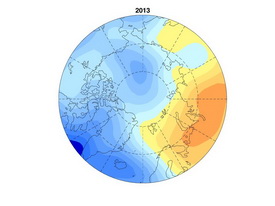
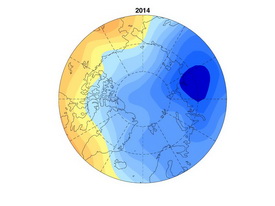
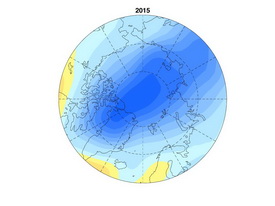
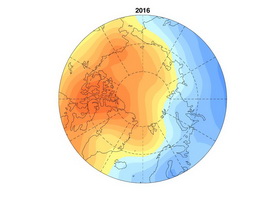
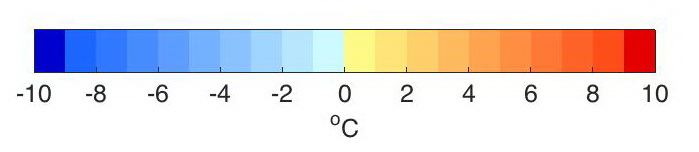
The stratosphere is the upper middle part of the atmosphere, and is the level of the Jet Stream winds. Colder temperatures in the stratosphere over the Arctic are associated with the positive phase of the Arctic Oscillation, and are indicative of stronger polar winds. The polar vortex is the pattern of winds around the North Pole, shown in the figure (right) from the Discovery Channel. Click to see a larger image. The following figures are maps showing a northern polar view of stratospheric temperature anomalies in March for different years. The extensive region of colder dark blue temperatures are indicative of stronger polar vortex winds. An anomaly is the difference from a long term average for the same time of year. Note the change in intensity and location of this cold polar vortex from year to year. It is thought that conditions in the stratosphere may influence conditions in the rest of the atmosphere. Six of the nine years in the 1990s had colder stratospheric temps and stronger vortex winds compared to the warmer conditions in the 1980s. After that, conditions were more variable. See the YouTube animation of the stratospheric temperature anomalies in March (1981 - 2016).
Find more information (references and websites):
|
|||||||||||||||||||||||||||||||||||||||||||||||||||||||||||
| About | http://www.pmel.noaa.gov/arctic-zone/detect oar.pmel.arctic.webmaster@noaa.gov DOC | NOAA | PMEL | Arctic Zone | Arctic Change Detection Privacy Policy | Disclaimer |
|||||||||||||||||||||||||||||||||||||||||||||||||||||||||||