Arctic Change NOAA
A near-realtime Arctic Change Indicator website

HOME
NEWS
OVERVIEW
TABLE OF INDICATORS
CLIMATE
Arctic Oscillation
Surface Temps
Stratospheric Temps
Clouds
Ocean
GLOBAL
Global Temperatures City Temps
Ocean Overturning
LAND
Roads
Permafrost
Tundra
Rivers
Waterfowl
Caribou
MARINE ECOSYSTEM
Overview
Bering Sea
Barents Sea
Greenland
ICE
Sea Ice
North Pole
Glaciers
Snow Cover
HUMAN
Socio-economic
Shishmaref
Marine Access
Canadian Marine
Roads

Overview

The objective of this website is to present recent indicators that describe the present state of the Arctic climate and ecosystem in an accessible, understandable, and credible historical context. A summary of changes are listed in the Table of Indicators.

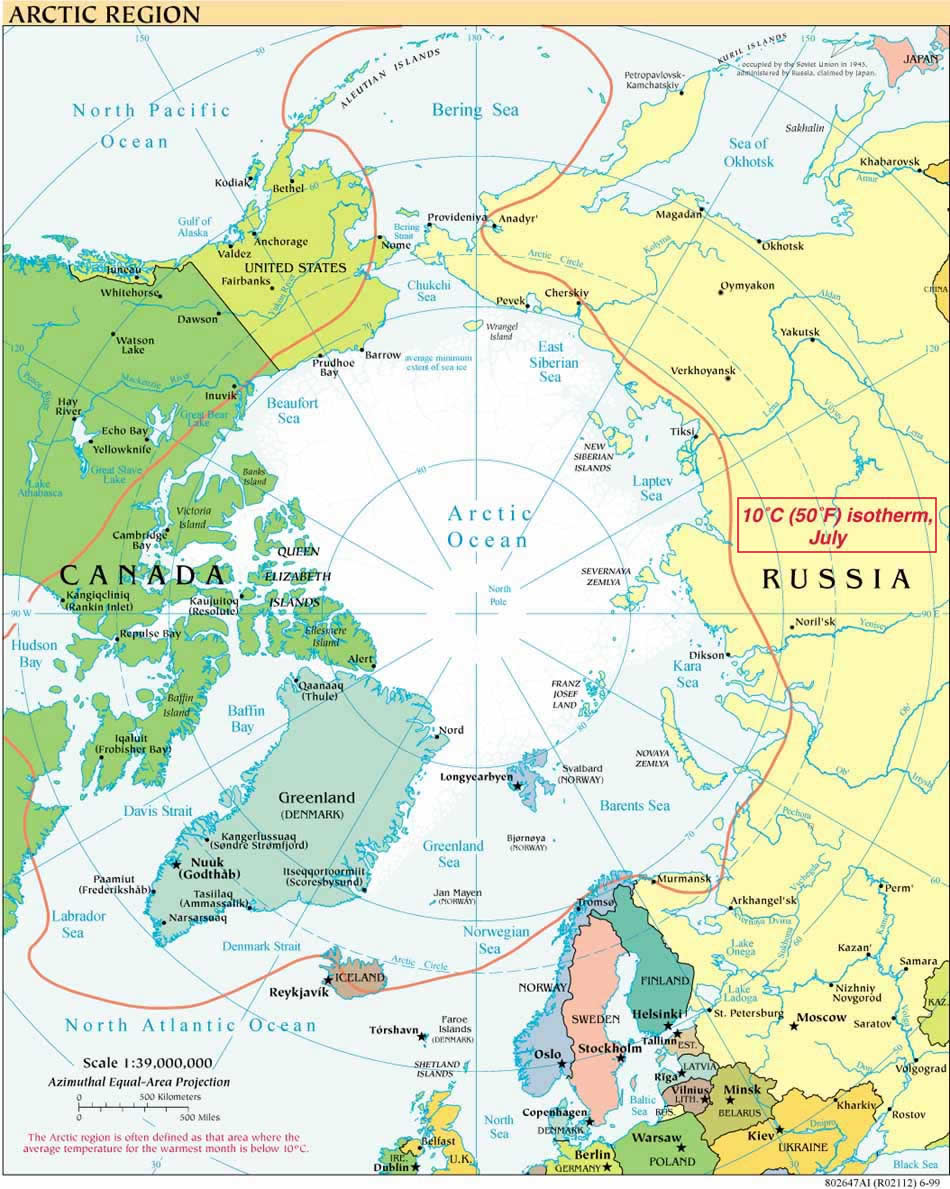
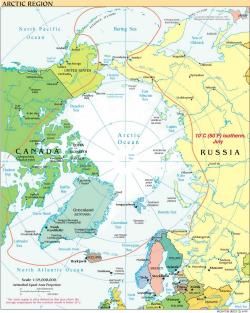
The Arctic is a vast, ice-covered ocean that is surrounded by tree-less, frozen land, which is often covered with snow and ice. The rigors of this harsh environment are a challenge to living, working and performing research in the Arctic. None the less, the Arctic is an ecosystem that teems with life including organisms living in the ice, fish and marine mammals living in the sea, birds, land animals such as wolves, caribou and polar bears, and human societies.

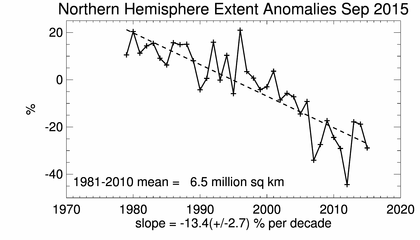
The Arctic has been changing in the last 30 years, as noted throughout this website. Some of the clearest indicators of this change are shown below: the warming of spring temperatures in Alaska, the warming of winter temperatures in N Europe, the loss of sea ice area in the central Arctic, and the conversion of tundra to wetlands and shrub lands in E. Siberia and NW Canada and Alaska. These changes in physical conditions also have impacted marine and terrestrial ecosystems. To see more details, click on the topics in the navigation panel on the left.

Sea ice extent trend for Northern Hemisphere
Barrow April Temperture Anomaly
Tromso Winter Temperature Anomaly

Surface air temperature anomaly for Barrow, Alaska in April and for Tromso, Norway in Winter. An anomaly is the difference from a long term average value for the same season. For Barrow, note the temperatures from 1990 onward are often more than 4 degrees above historical values. For Tromso, note the continuation of warm temperatures in the 1990's following a period of cold temperatures in the late 1970's and 1980's.

Data from Global Historical Climate Network (GHCN). Updates made using the World Monthly Surface Climatology dataset (ds570.0) or, in some instances, from the NCDC Summary of the Day data. For more information see Surface Temperatures.


Sea ice extent trend for Northern Hemisphere
Sea ice extent trend for the Northern Hemisphere for the end of summer. From the National Snow and Ice Data Center. for more information see Sea Ice.


Tundra area data
 
Tundra area based on satellite (NDVI) data and the Koppen Classification, which is based on a temperature threshold (temperatures from NCEP and CRU). From Wang, M., and J.E. Overland (2004): Detecting Arctic Climate change using Koppen classification. Clim. Change [In press]. For more information, see Tundra.

Here is another website that presents information about Arctic Climate Change:http://www.pmel.noaa.gov/arctic-zone/reportcard/

Find more information (references and websites):