
|
|
||
Ice - Surface melting revealed by the North Pole Environmental Observatory |
|||||||||||||||||||||||||||||||||||||||||||||||||||||||||||||||||||||||||||||||||||||||||||||||||||||||||||||||||||||||||||||||||||||||||||||||||||||||||||||||||||||||||||||||||||||||||||
|
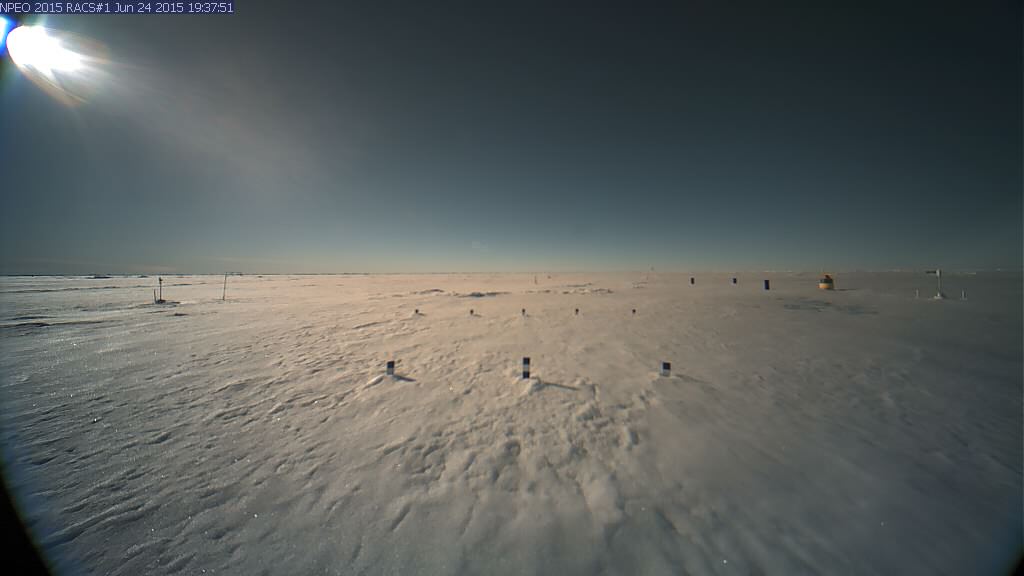
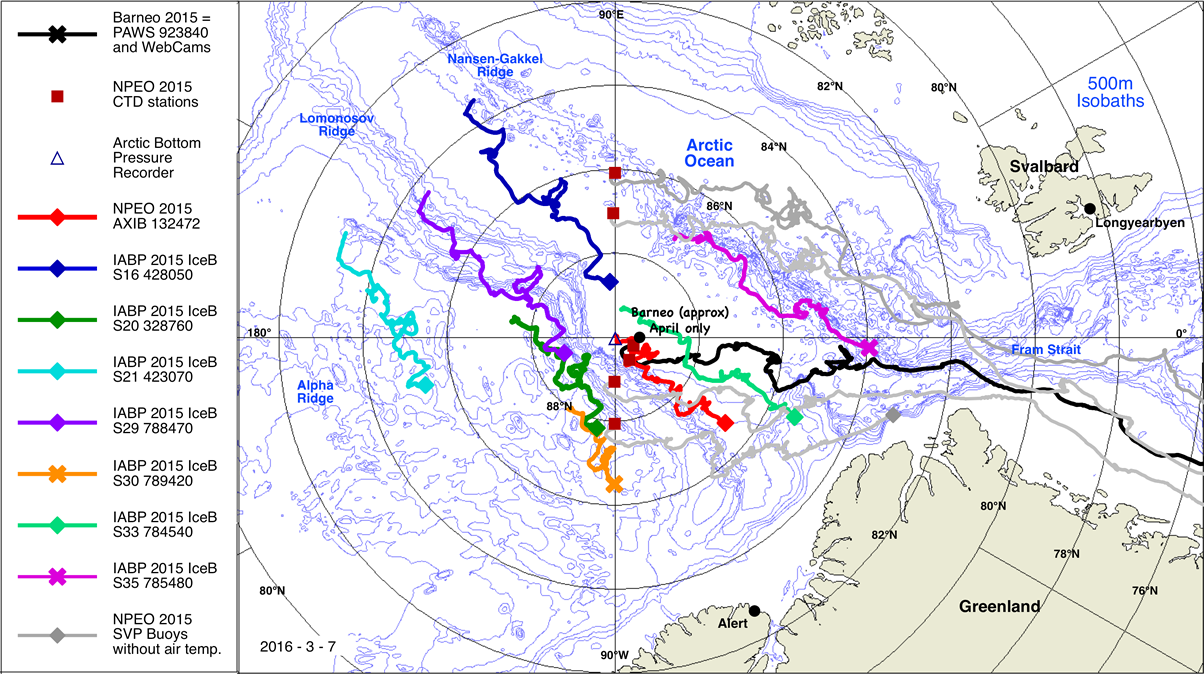
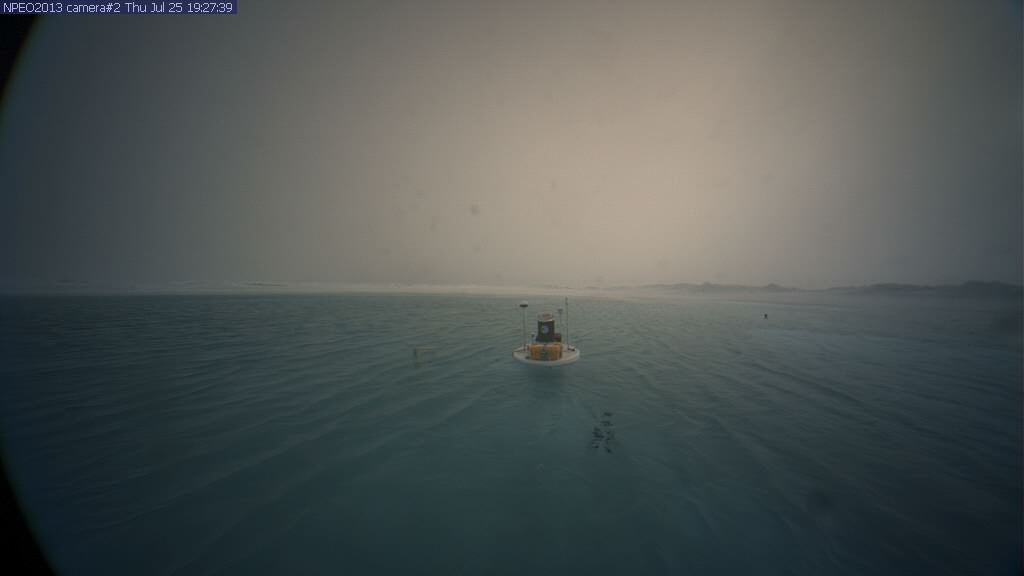
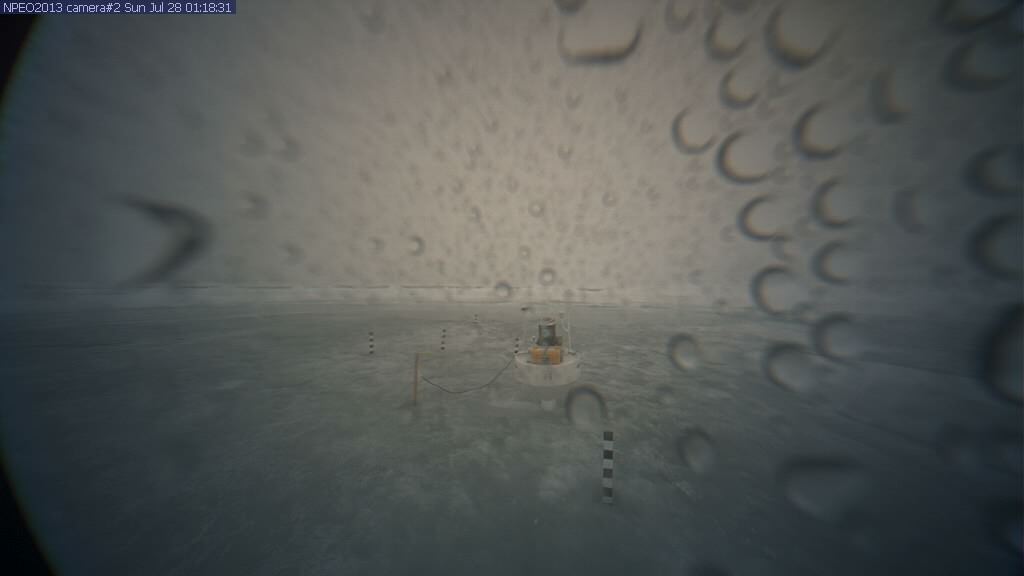
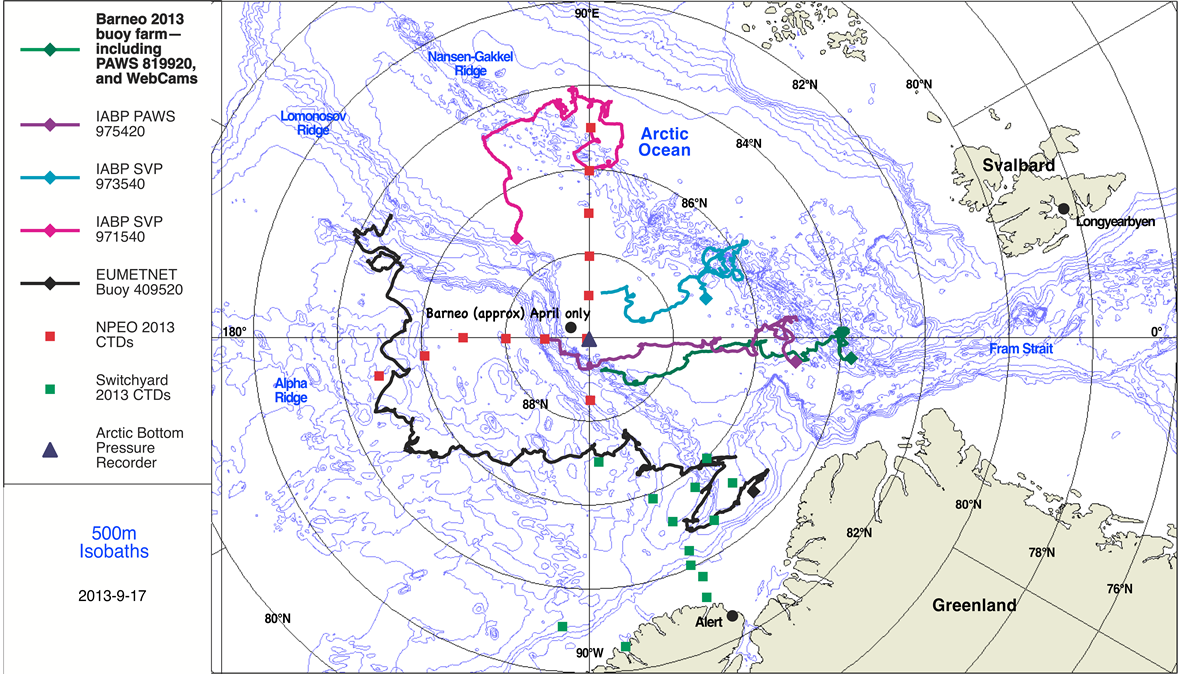
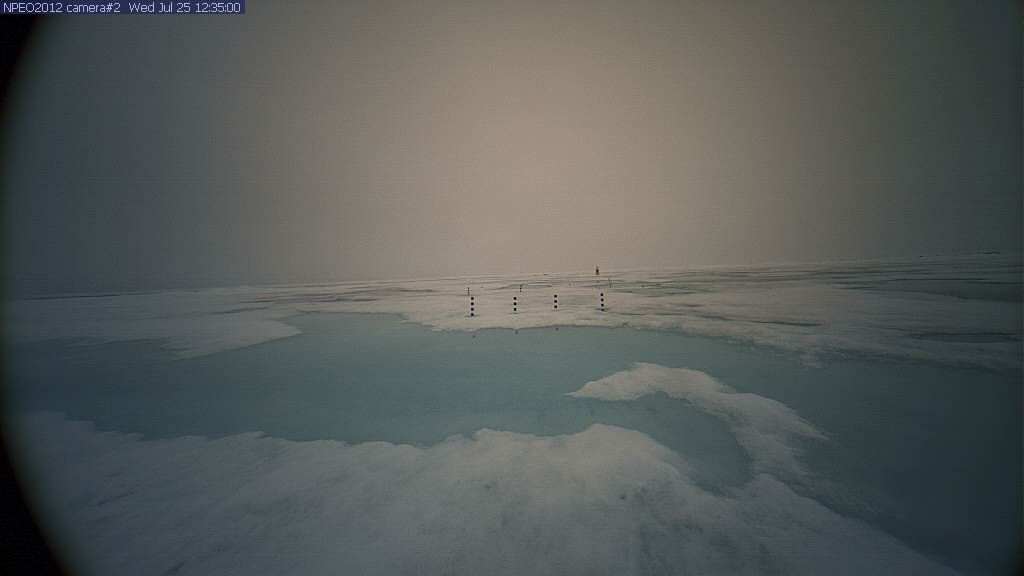
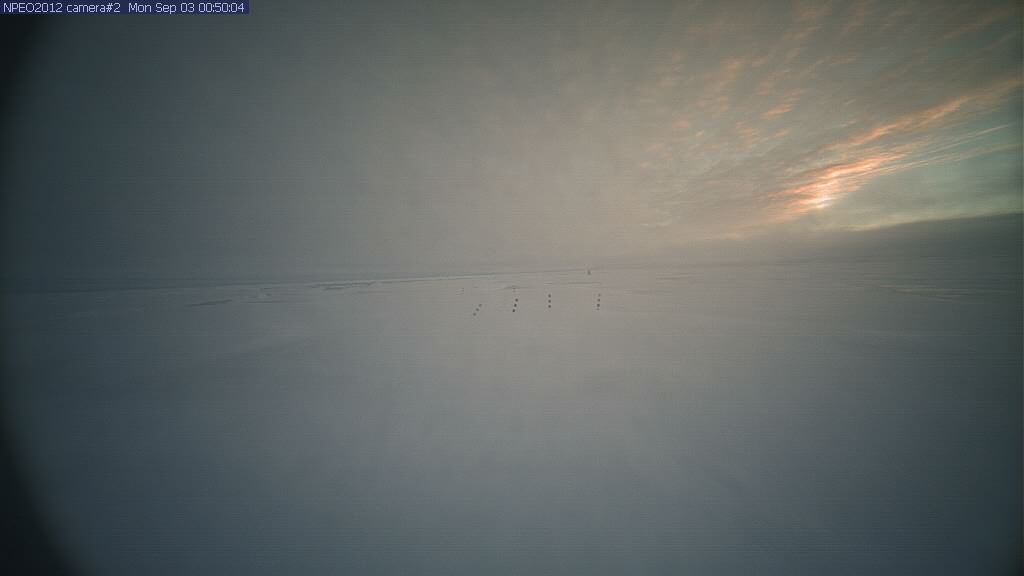
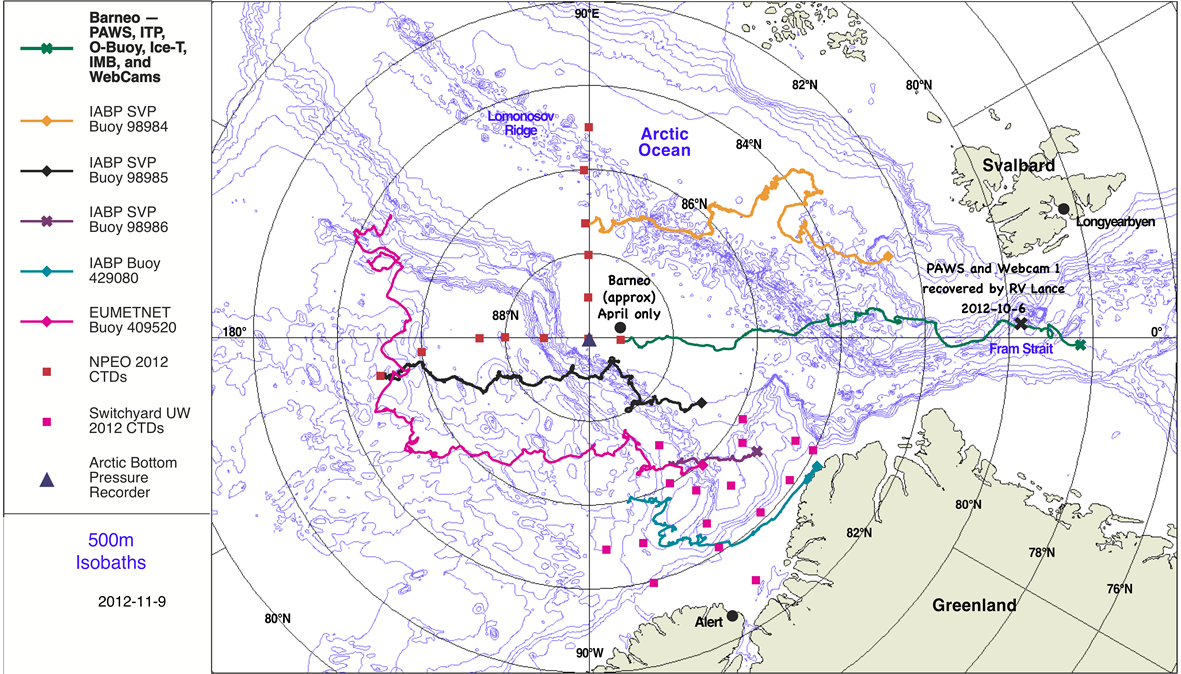
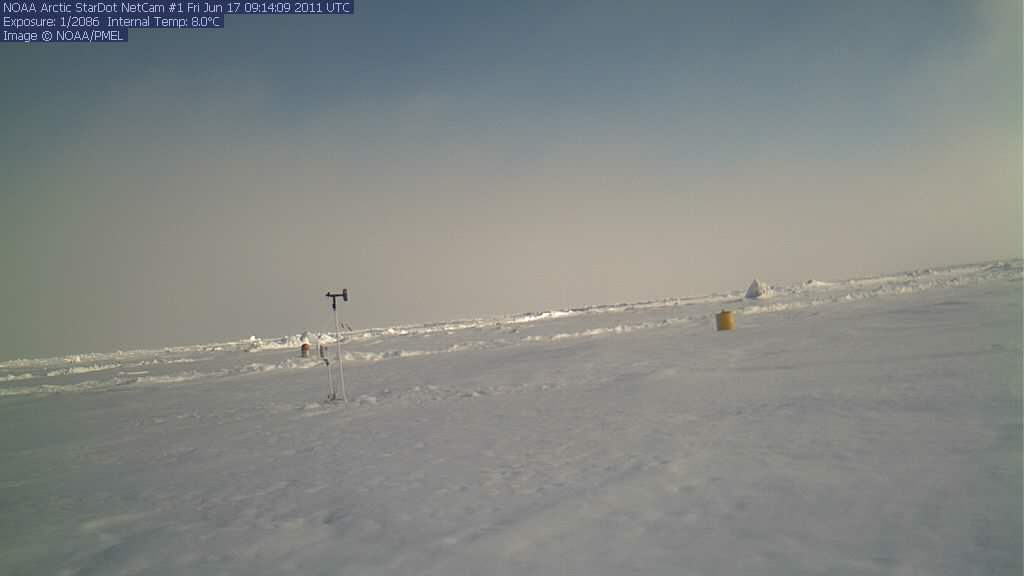
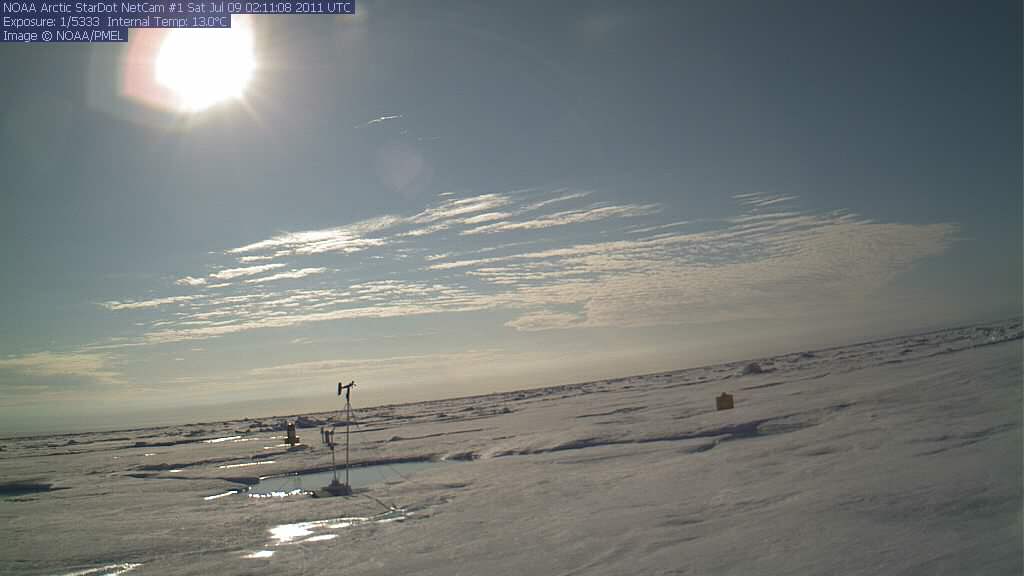
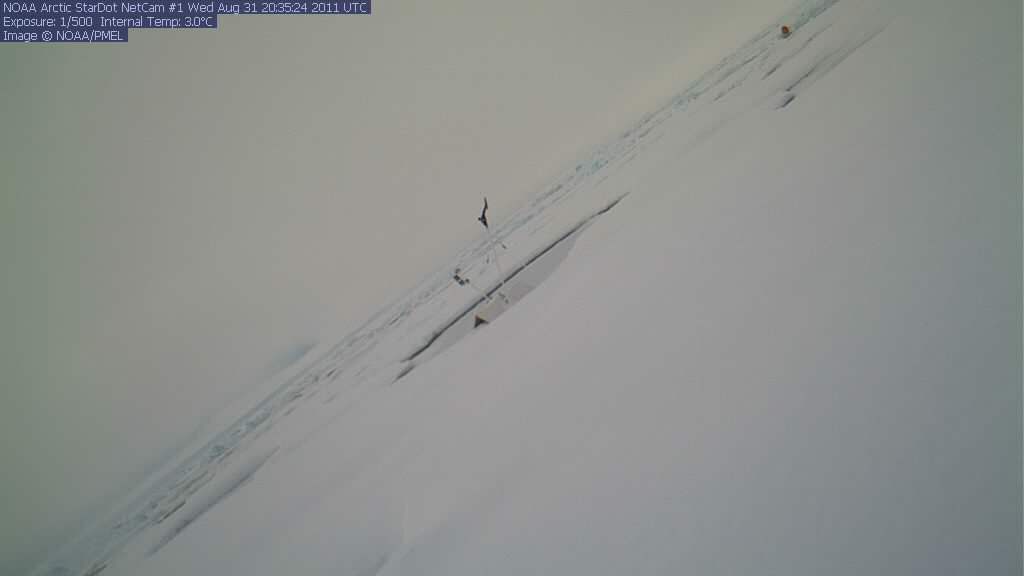
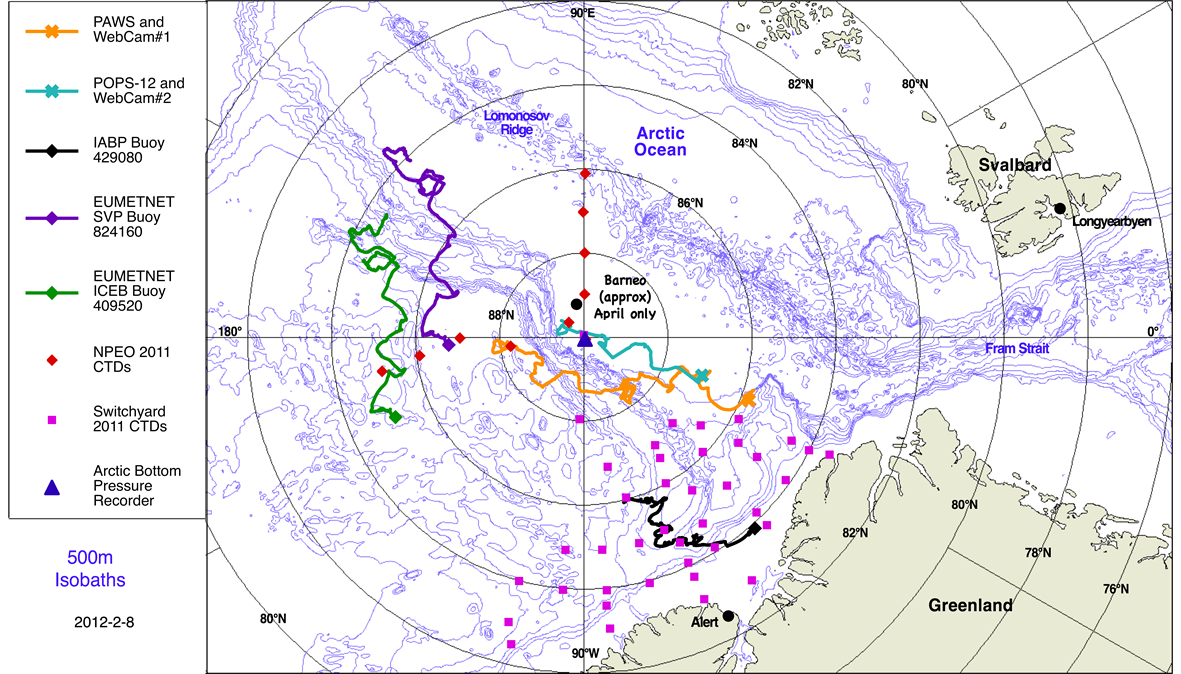
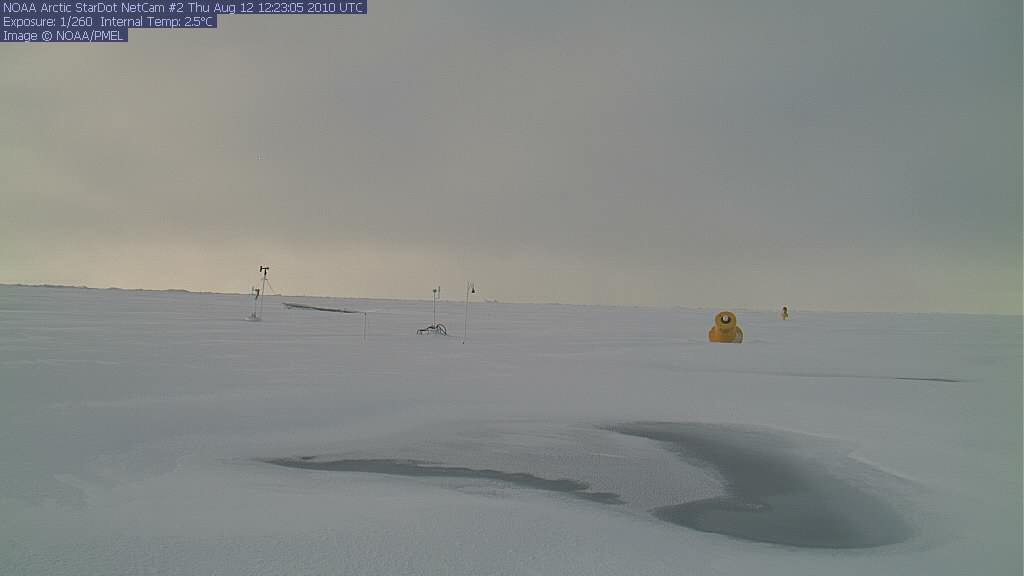
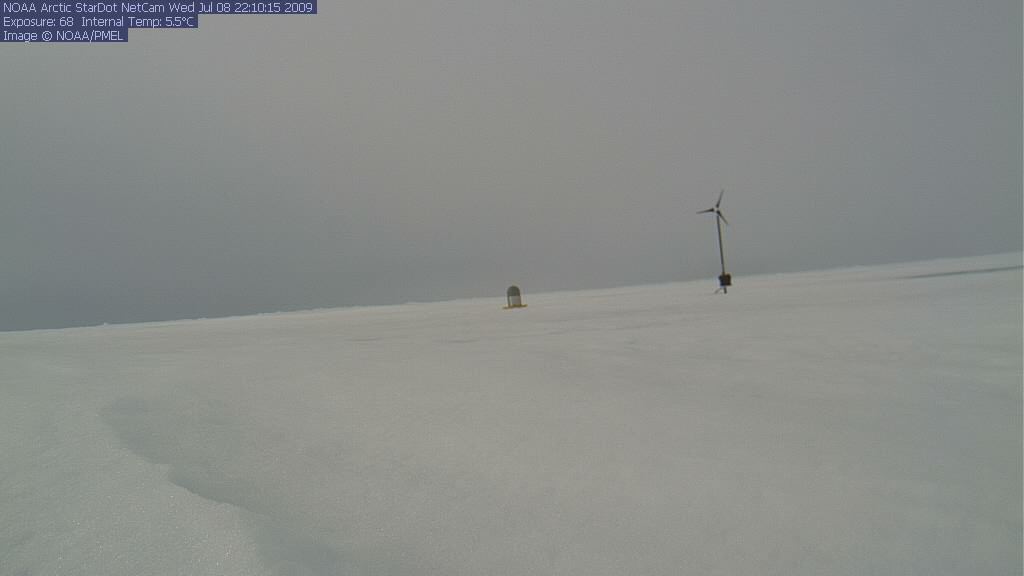
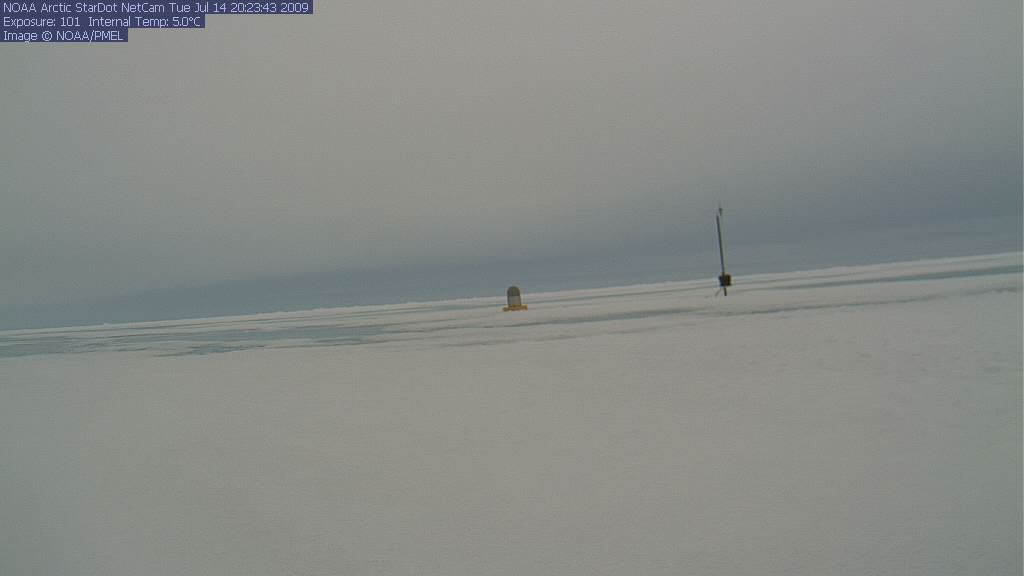
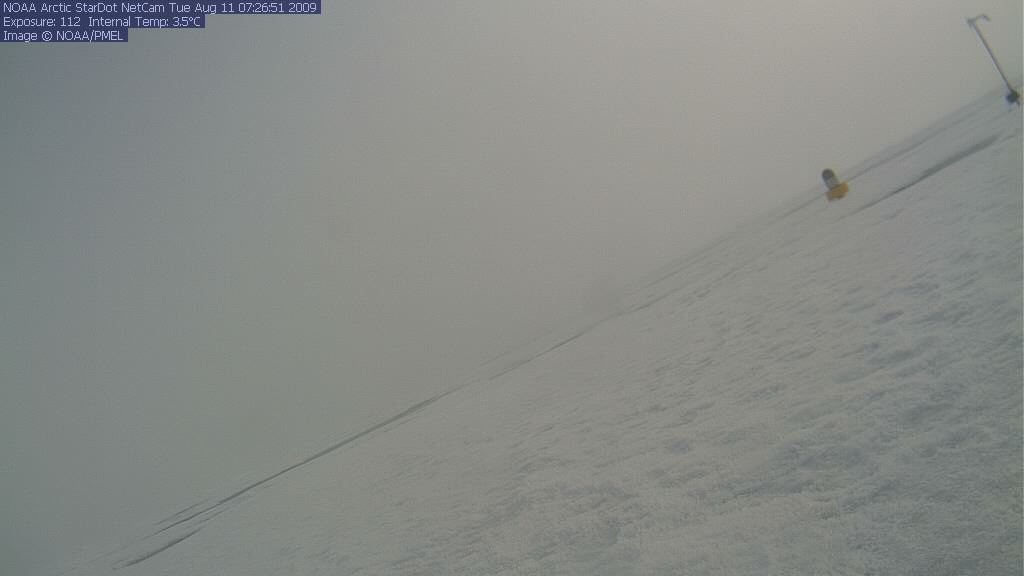
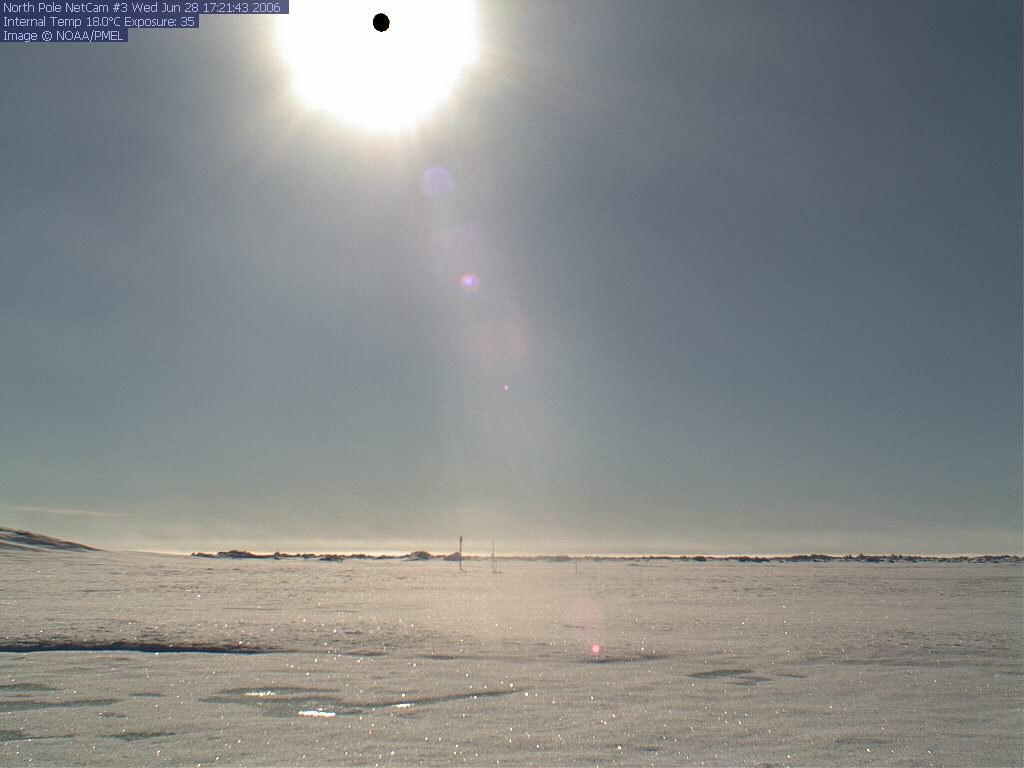
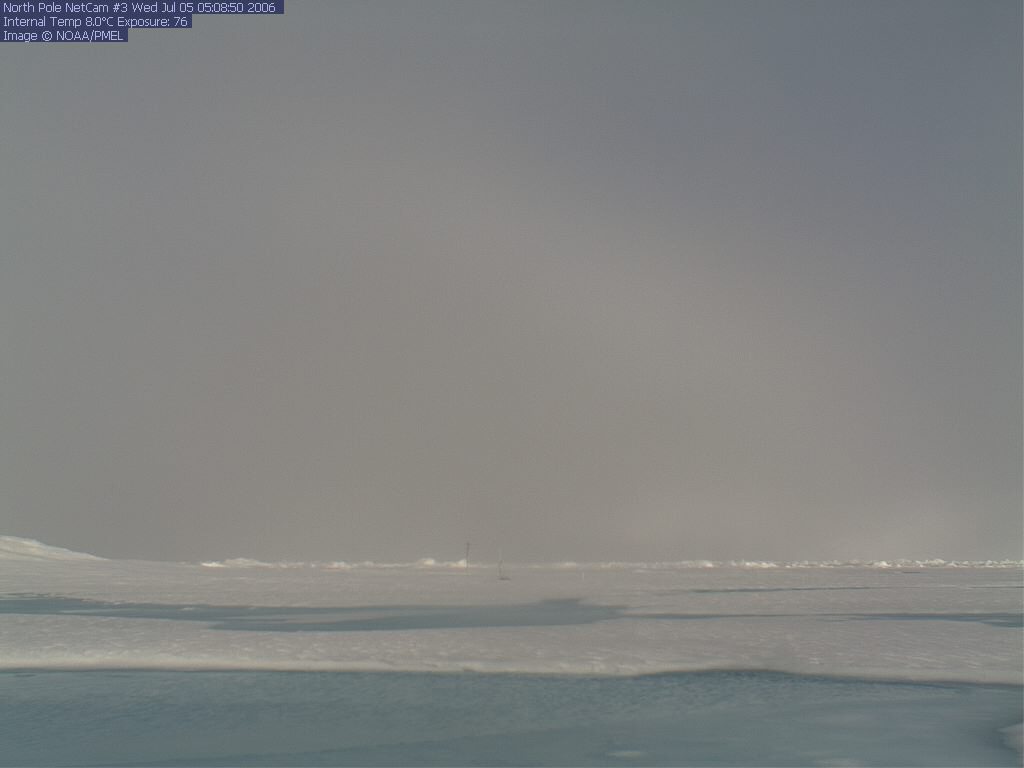
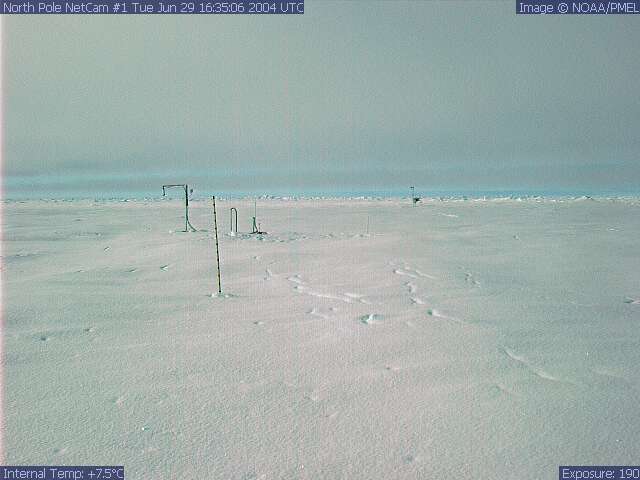
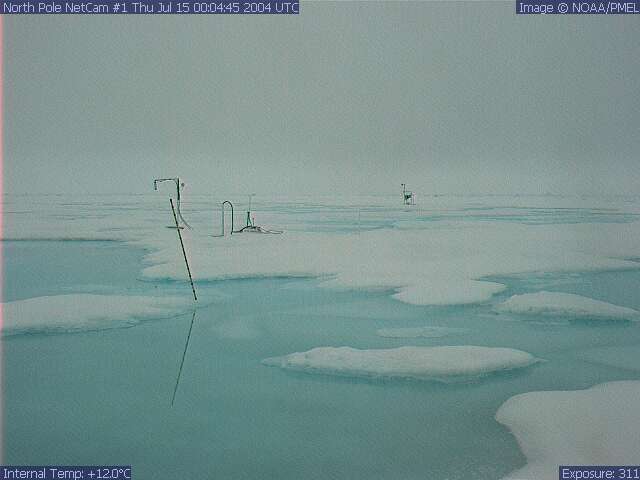
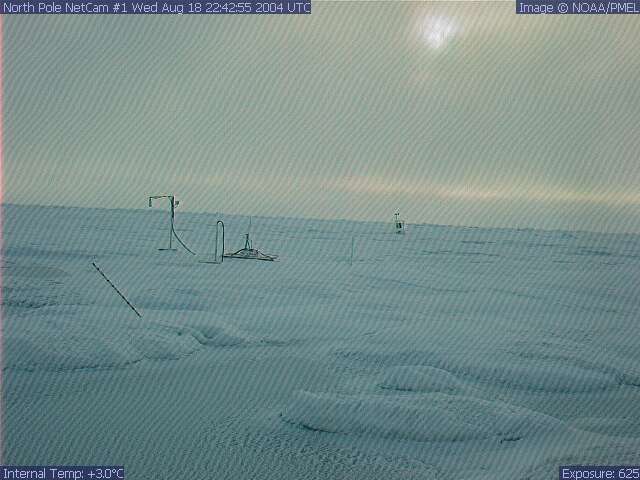
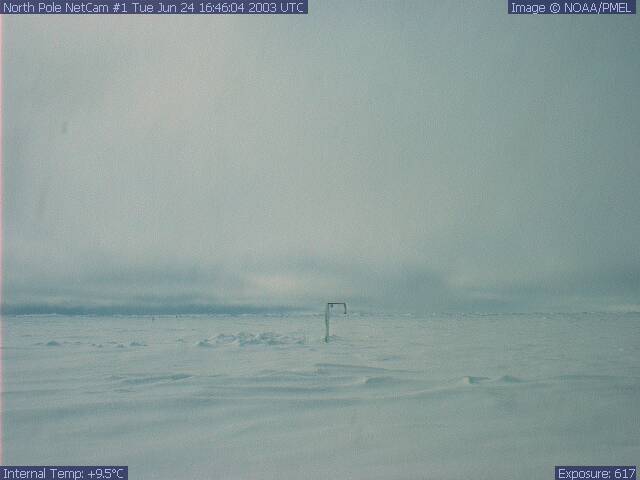
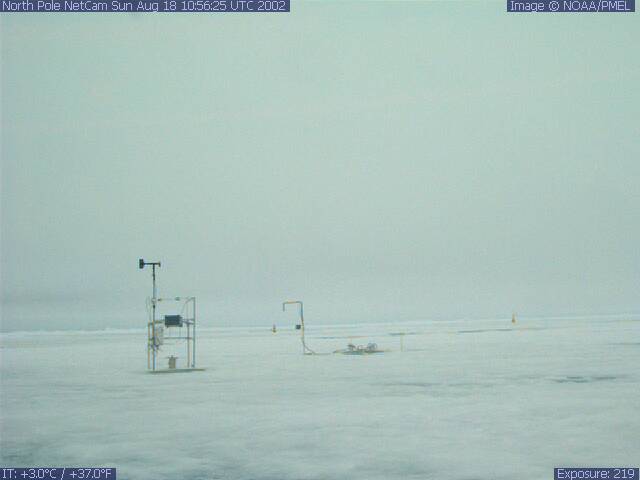
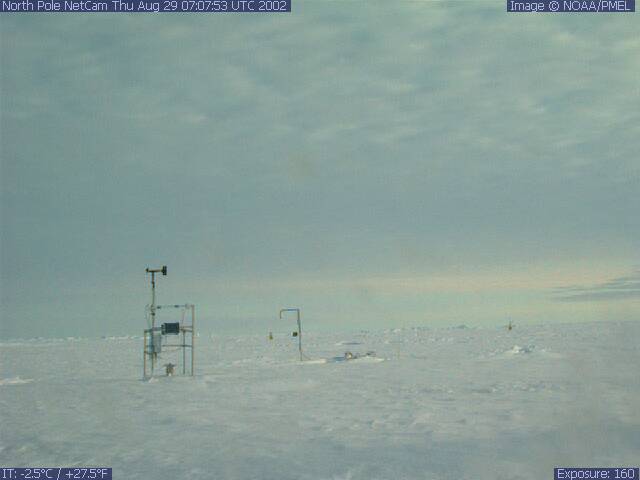
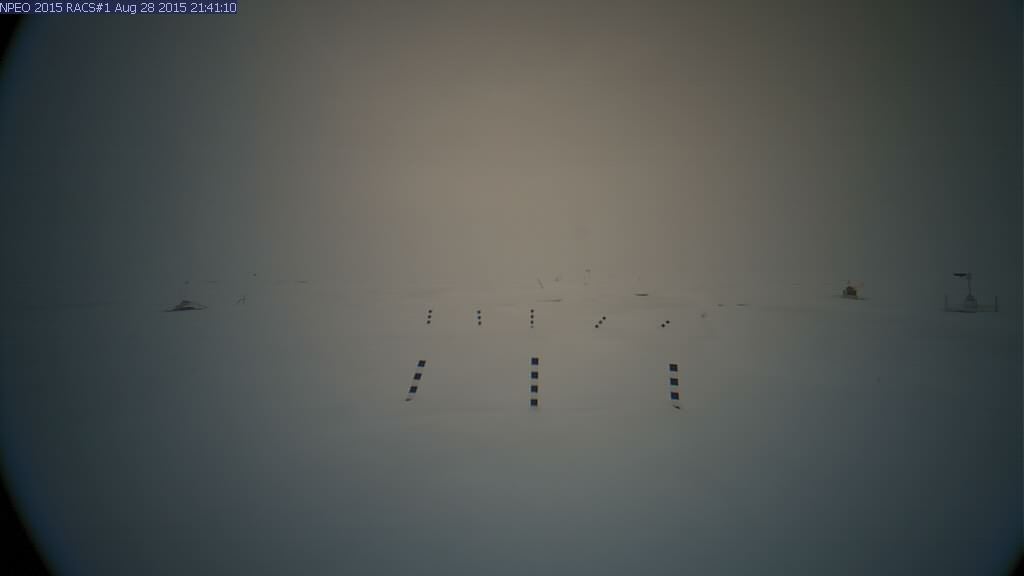
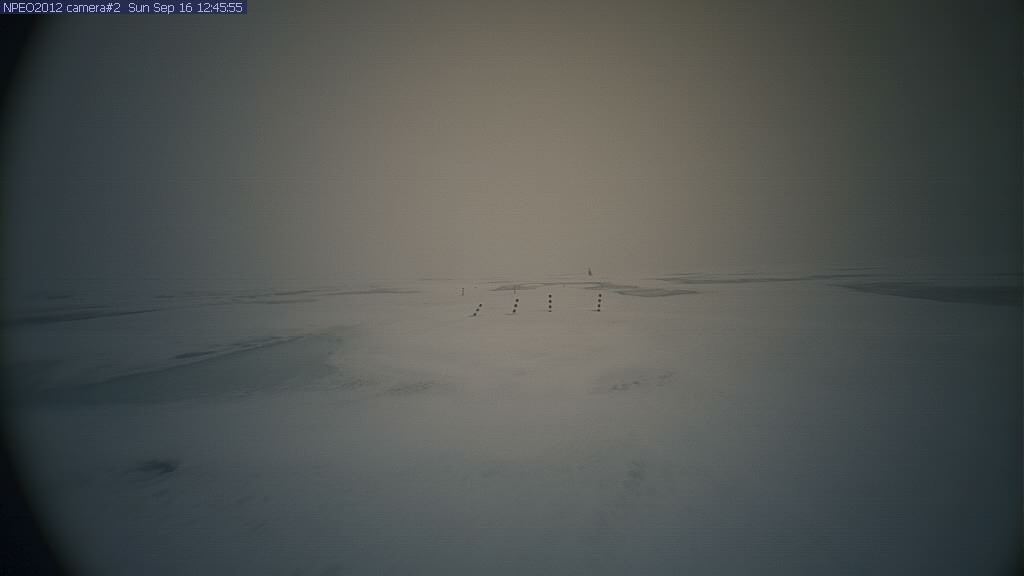
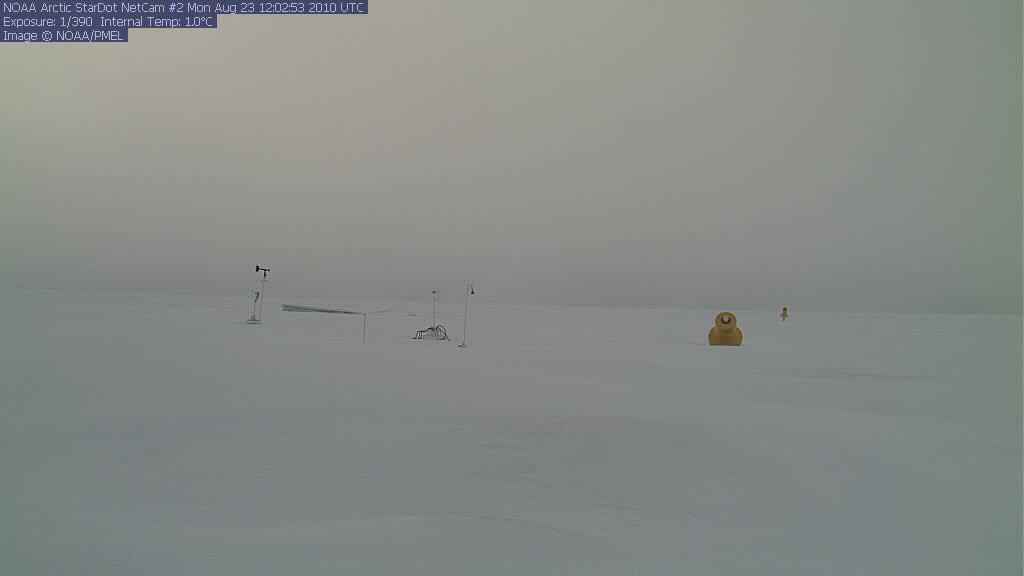
Sea Ice | North Pole Observations | Glaciers | Snow Cover Since 2002, the multi-agency USA-Japan joint project entitled "North Pole Environmental Observatory" (NPEO) has deployed Web Cameras along with instruments that monitor air, ice and ocean conditions. The cameras and instrumentation are deployed in Spring on an ice floe drifting southward from the North Pole (drift maps are shown below). The Web Cams provide an otherwise unobtainable view of sea ice conditions throughout the Arctic summer. Animations of the images are available as YouTube videos. The summers observed by the North Pole Web Cams were very different, as seen in the table below. A brief commentary for different observation years follows the table. Summer sea ice transition information was not available for 2005 or 2007 or 2014. or 2016 (webcam was not deployed in 2016). Update: Due to funding constraints, it was impossible to deploy Web Cams in Spring 2016, but deployments are planned for Spring 2017.
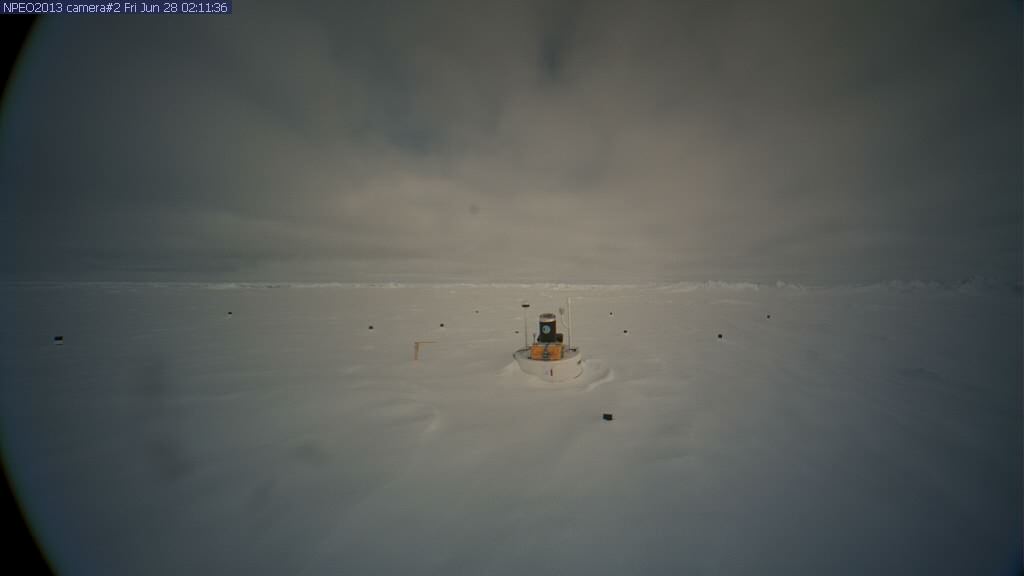
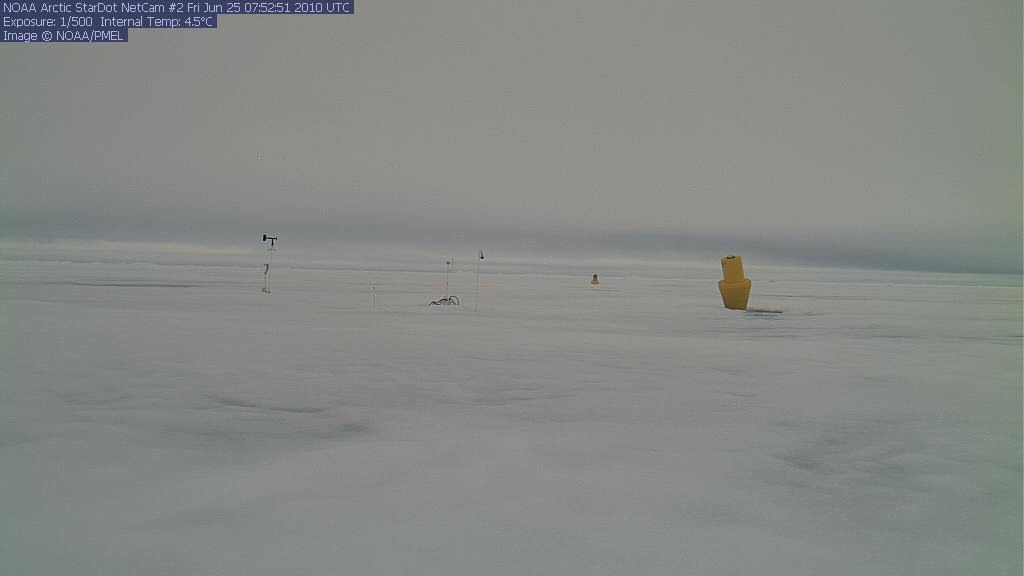
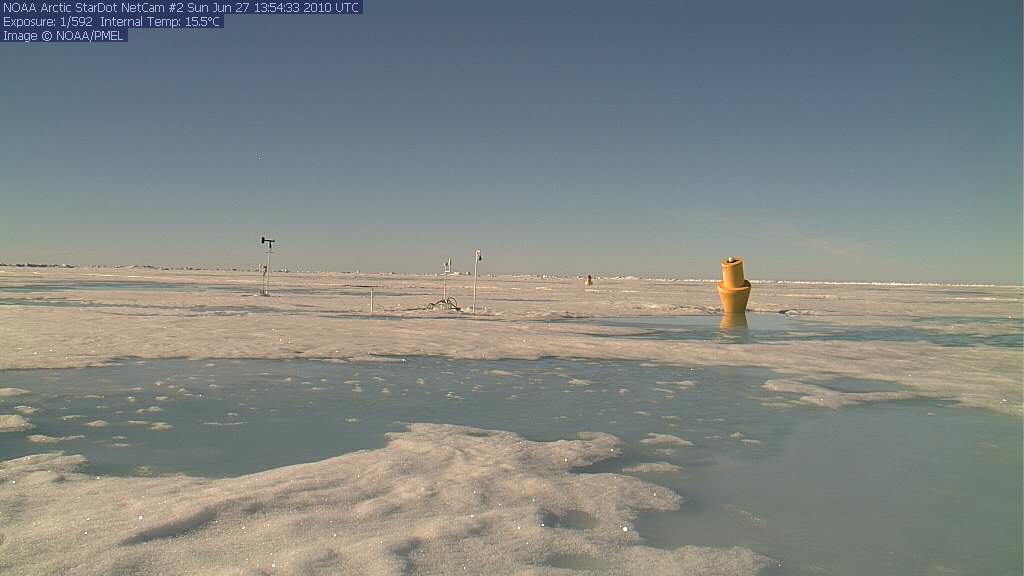
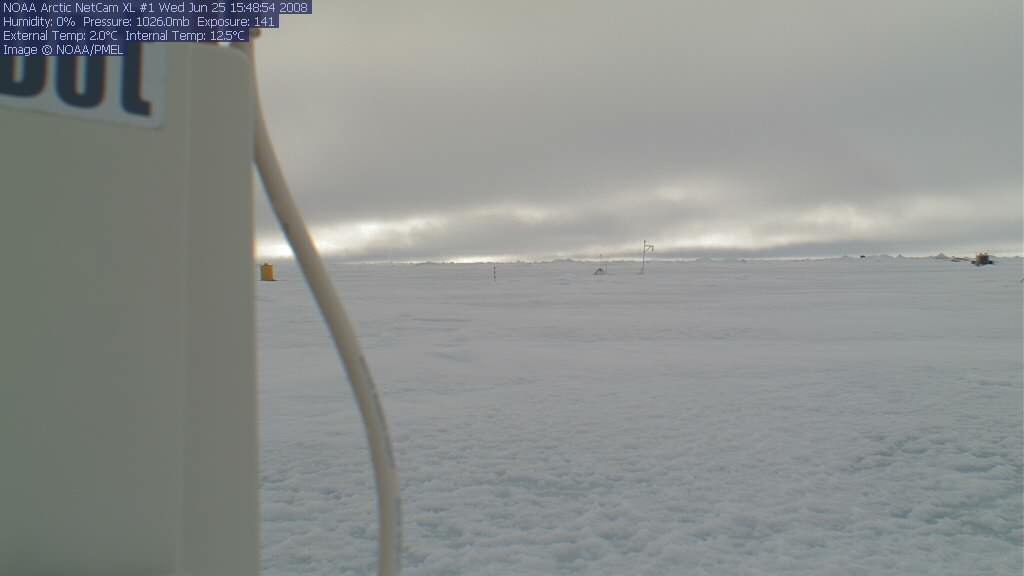
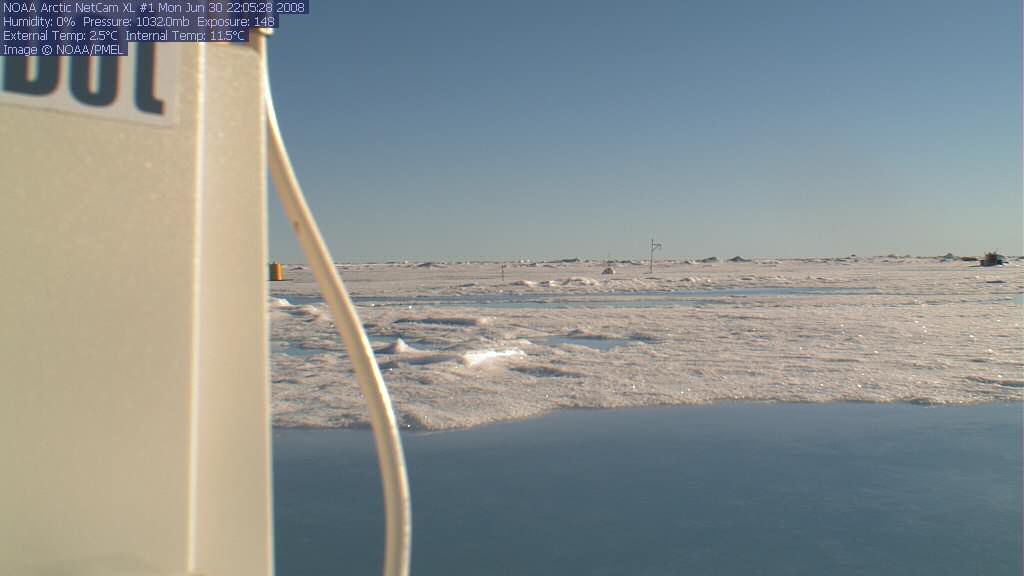
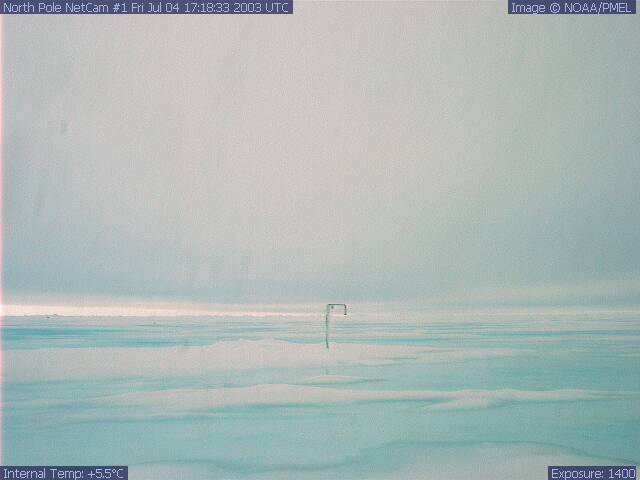
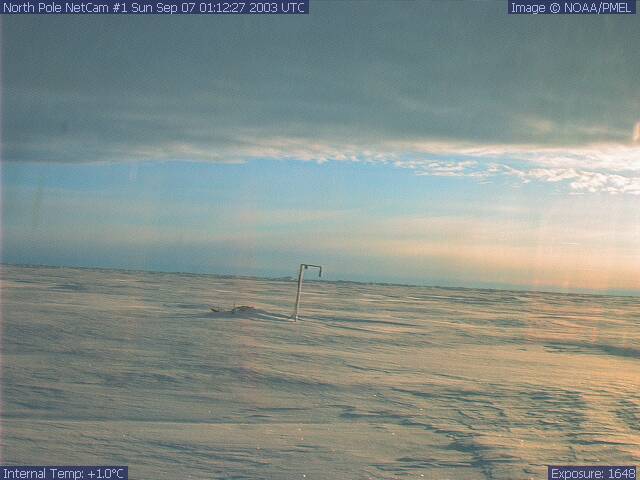
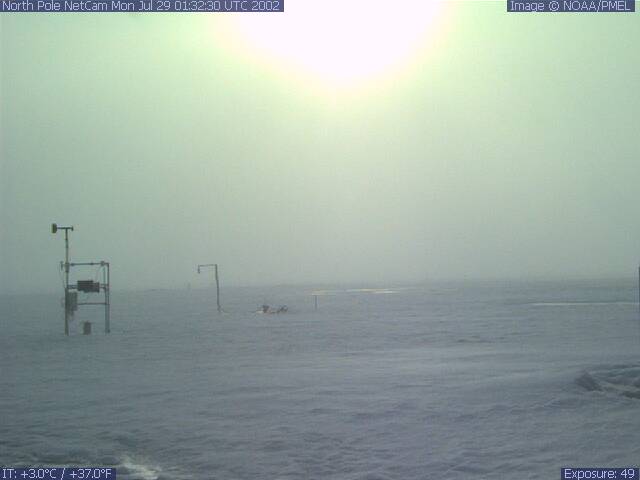
Commentary: In 2012, on August 26, the Arctic sea ice extent reached the lowest value observed during the satellite record. Following that low, Arctic sea ice extent continued to drop, falling below 4 million square kilometers by September 5. Compared to September conditions in the 1980's and 1990's, this represents a 45% reduction in the area of the Arctic Ocean covered by sea ice. (Reference: National Snow and Ice Data Center). "First impressions from our 2012 North Pole Environmental Observatory (NPEO) deployment and initial Seasonal Sea Ice Zone Reconnaissance Survey (SIZRS) are that there is quite a bit more snow on the ice than in the last few years and there is more ocean heat than ever right below the mixed layer." (From the June discussion by J. Morison,University of Washington, in the Pan-Arctic Sea Ice Outlook in the SEARCH Sea Ice Outlook.) In 2011, the Arctic lost sea ice very rapidly in the first half of July. Ice loss slowed in late July-early August, but resumed again later in August. The September 2011 sea ice minimum was at or near a record low. In 2010, the snow became soft Jun 25, similar to many other years, but widespread meltponds formed by Jun 27, earlier than in any of the other years observed by the webcams. Freezeup began Aug 12 and meltponds were covered by Aug 23. In 2009, the snow became soft and meltponds started to form July 8, but never became very widespread, with the maximum meltpond extent observed around July 14-16. Meltponds were closing over by Aug 11, but small slits of open water were still visible Sept 8. After that date, only one image was received from the web cam, on Sept 25, at which time the melt ponds were all snowcovered. In summary, in 2009, onset of melt was later than most years (later only in 2002). Meltpond coverage was less widespread than any year observed by the web cams other than 2002, but the snow remained soft later than most years (at least through Sept 8). In 2008, the snow became waterlogged June 25, and extensive meltponds formed quickly, only five days later (June 30). Meltponds are still observed August 25 in standard web cam images. After that time, the only clear images are from another webcam with a fisheye lens observing sky conditions, but also revealing snow conditions. Meltponds are visible on the fisheye image from September 14. Although further images are at least partially obscured by water drops or snow on the lens, there appears to be snow cover in an image from September 22. In summary, in 2008, the onset of melt progressed more quickly than in previous years, and melt ponds persisted longer and later than usual. 2002 - 2004: The onset of melting is typically in early June, but occurred in late July in 2002, and late June in 2003 and 2004. The Web Cam images show very limited melt pond coverage in 2002, but widespread melt pond coverage in 2003 and 2004. In 2003, the melt ponds were widespread by July 4, but diminished in late July, and then reformed in mid-August. Freezeup began in late August in 2002, Sept 7 in 2003, and in mid-August in 2004. Summer sea ice transition information was not available for 2005 or 2007 or 2014. Find more information:
|
|||||||||||||||||||||||||||||||||||||||||||||||||||||||||||||||||||||||||||||||||||||||||||||||||||||||||||||||||||||||||||||||||||||||||||||||||||||||||||||||||||||||||||||||||||||||||||
| About | http://www.pmel.noaa.gov/arctic-zone/detect oar.pmel.arctic.webmaster@noaa.gov DOC | NOAA | PMEL | Arctic Zone | Arctic Change Detection Privacy Policy | Disclaimer |
|||||||||||||||||||||||||||||||||||||||||||||||||||||||||||||||||||||||||||||||||||||||||||||||||||||||||||||||||||||||||||||||||||||||||||||||||||||||||||||||||||||||||||||||||||||||||||


