
|
|
||
Global - Global Temperature Trends: 2015 Summation |
|||||||||||||||||||
|
Global Temperatures | City Temperatures | Ocean Overturning NASA, NOAA Analyses Reveal Record-Shattering Global Warm Temperatures in 2015Earth’s 2015 surface temperatures were the warmest since modern record keeping began in 1880, according to independent analyses by NASA and the National Oceanic and Atmospheric Administration (NOAA), as reported on NASA’s Goddard Institute of Space Studies (GISS) website. The record-breaking year continues a long-term warming trend — 15 of the 16 warmest years on record have now occurred since 2001. (NASA Press Release, 1/20/2016).
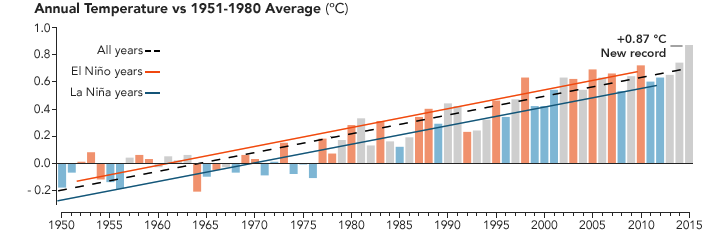
Globally-averaged temperatures in 2015 shattered the previous mark set in 2014 by 0.23 degrees Fahrenheit (0.13 Celsius). Only once before, in 1998, has the new record been greater than the old record by this much. The 2015 temperatures continue a long-term warming trend, according to analyses by scientists at NASA’s Goddard Institute for Space Studies (GISS) in New York (GISTEMP). NOAA scientists agreed with the finding that 2015 was the warmest year on record based on separate, independent analyses of the data. Because weather station locations and measurements change over time, there is some uncertainty in the individual values in the GISTEMP index. Taking this into account, NASA analysis estimates 2015 was the warmest year with 94 percent certainty. “Climate change is the challenge of our generation, and NASA’s vital work on this important issue affects every person on Earth,” said NASA Administrator Charles Bolden. “Today’s announcement not only underscores how critical NASA’s Earth observation program is, it is a key data point that should make policy makers stand up and take notice - now is the time to act on climate.” Most of the warming occurred in the past 35 years, with 15 of the 16 warmest years on record occurring since 2001. Last year was the first time the global average temperatures were 1 degree Celsius or more above the 1880-1899 average. Phenomena such as El Niño or La Niña, which warm or cool the tropical Pacific Ocean, can contribute to short-term variations in global average temperature. A warming El Niño was in effect for most of 2015. “2015 was remarkable even in the context of the ongoing El Niño,” said GISS Director Gavin Schmidt. “Last year’s temperatures had an assist from El Niño, but it is the cumulative effect of the long-term trend that has resulted in the record warming that we are seeing.”
Read the complete analysis and discussion from the NASA Research News: NOAA National Centers for Environmental Information summary is at: Find more information (references and websites)
|
|||||||||||||||||||
| About | http://www.pmel.noaa.gov/arctic-zone/detect oar.pmel.arctic.webmaster@noaa.gov DOC | NOAA | PMEL | Arctic Zone | Arctic Change Detection Privacy Policy | Disclaimer |
|||||||||||||||||||