
|
|
||
Global - City Temperatures |
||||
|
Global Temperatures | City Temperatures | Ocean Overturning
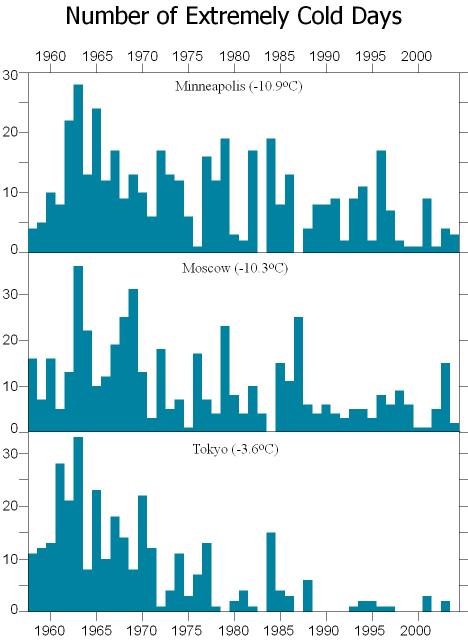
This page shows how the Arctic can influence weather further south. Changes in the polar winds can impact the weather at lower latitudes. We have selected three cities that are representative of this impact. Atmospheric winter winds in the northern mid-latitude regions of the northern hemisphere tend to have periods when the winds blow from west to east, and periods when the winds follow a more wavy pattern with winds from the south in one region adjacent to regions with winds from the north. A way to track the occurrence of the wavy pattern is to note the number of days in each winter in which there are cold winds from the north. Shown below are a decrease in the number of extremely cold days for Minneapolis, Moscow and Tokyo (three mid-latitude cities) from the 1960s to the 1990s. This shows how the Arctic can influence weather further south. Not all of these changes may be from Arctic climate effects. The warming of cities from building over time, called the "heat island" effect, may also contribute to warming.
Find more information (references and websites):
|
||||
| About | http://www.pmel.noaa.gov/arctic-zone/detect oar.pmel.arctic.webmaster@noaa.gov DOC | NOAA | PMEL | Arctic Zone | Arctic Change Detection Privacy Policy | Disclaimer |