Norbert
Untersteiner
Sydney Chapman Professor
University of Alaska Fairbanks
and
Professor Emeritus, Atmospheric Sciences and Geophysics
University of Washington
Seattle, WA
Background
Drifting buoys deployed under the multi-agency USA-Japan joint projects entitled "North Pole Environmental Observatory" (NPEO) continue to yield valuable sets of air/ice/ocean data. The primary websites informing the public of these projects, and showing preliminary data, are located at https://www.pmel.noaa.gov/arctic-zone/gallery_np.html and at http://psc.apl.washington.edu/northpole/index.html.
 |
| Fig. 1 Drift tracks of the NPEO data buoys in 2002 and 2003 |
In both 2002 and the 2003, automatic stations were deployed on an ice floe near the North Pole and started recording and telemetering data in May, with the ice floe drifting on similar paths toward Spitsbergen. Instruments included short-wave and long-wave radiometers for down-welling radiation, air temperature, wind direction and velocity, atmospheric pressure, ice temperature, and ocean temperature and salinity to 250 m depth.
In addition to the above mentioned instruments, the field teams installed Web Cameras to show the installations and some scenery. These "web cams" collected and transmitted images throughout the entire summer, from the beginning of snow melt to freeze-up in autumn and the onset of darkness.
Difficulty of Summertime Observations at the North Pole
To appreciate the value of these data and images we should bear in mind that the proverbial "inaccessibility of the frozen Arctic Ocean" due to cold and darkness applies to the mild summer even more than to the cold and dark winter. During the long and mild days of summer melt snow and ice, the surface becomes littered with ponds and potholes, and the transportation of people and equipment is limited to the most difficult and expensive modes, i.e. helicopters and ice-breaking ships. It is for these reasons that all-year manned drifting ice stations, and hence summertime data, have been at a premium in the history of US arctic research. While the Soviet Union maintained 30 such stations between 1952 and 1991, the US scientists were able to acquire only four sets of summer data, two from the International Geophysical Year 1957 and 1958, one year from the Arctic Ice Dynamics Joint Experiment in 1975, and one year from SHEBA in 1998.
Observations from the North Pole in summer 2002
The recently recorded data from automatic buoys and web cams represent a large, and very inexpensively obtained, increment of information about summer conditions in the central Arctic.
 |
| Fig. 2 Late July 2002 at the NPEO drifting station. The onset of surface melting is exceptionally late. |
The onset of melting usually occurs in early June, when the temperature reaches 0°C and the surface layer turns into a constant-temperature ice bath. In 2002, the temperature record shows an abrupt warming to about 0°C, on 24 May, suggesting an early arrival of the melt season. The warming event coincides with about a week of low short-wave (250 Wm-2) and high long-wave (300 Wm-2) down-welling radiation, which are typical of low overcast conditions. The web cam pictures of that period confirm the overcast. Both radiation and temperature values remained in the normal range for the rest of the summer, and freeze-up occurred as usual in the last week of August. Based on the early warming event in May, one may have expected an early onset of surface melting. Contrary to that expectation, the web cams show that it was not until late July 2002 when the snow cover took on a soggy appearance and isolated melt ponds appeared on the surface (Fig.2).
For the rest of the summer, the web cam pictures show only insignificant melt pond coverage until the deposition of new snow in late August. The pictures clearly show that snow from the preceding winter survived the entire summer, and we must assume that there was no, or very little, ice ablation at the surface.
Soviet (Russian) records suggest a small probability of an all-summer snow cover. But none of the U.S. ice camps experienced a persistent summer snow. In light of recent news about global warming and polar amplification, the all-summer snow cover of 2002 is clearly unexpected.
Observations from the North Pole in summer 2003
Like the summer of 2002, the subsequent summer of 2003 also shows a somewhat belated (end of June) appearance of melt ponds but, by the first week of July, pond coverage was wide spread (Fig. 3).
Unexpectedly, toward the end of July, pond coverage decreased markedly (Fig. 4) while radiation and air temperatures were still at their normal summer values. A possible explanation is that the ice had become sufficiently porous for the melt water ponds to drain by percolation.
However, in mid-August the melt ponds re-appeared (Fig. 5), putting in question the hypothetical pond drainage by percolation.
 |
 |
 |
||
| Fig. 3 On 4 July 2003, melt pond coverage was wide spread. | Fig.4 On 25 July 2003, the melt water pond coverage diminished, suggesting that the ponds may have drained by percolation. | Fig. 5 On August 14 2003, after about a half month of little pond coverage, surface melting appears to have resumed, covering large areas with melt water. |
The melt ponds shown in Fig.5 remained unfrozen until the end of the month. During the first days of September they were covered by new snow (Fig. 6).
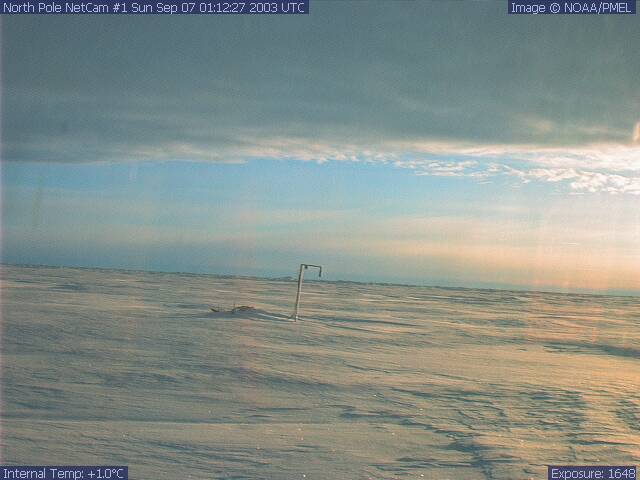 |
| Fig. 6 In the first week of September 2003, melt ponds were covered by new snow. |
The preceding samples illustrate the extraordinary value of the web cam pictures. This technology has clearly produced a large amount of information at a very low cost and the current project is only a beginning. Fish-eye lens cameras pointing to the zenith can be employed to observe cloud amount. A camera could be used to measure accumulation/ablation by taking pictures of suitably marked stakes, a method that would yield more representative values than those from a sonic device that looks at a single point. Cameras could also be used to take pictures of radiometers and other instruments to determine whether their readings are compromised by rime deposition. A persistent difficulty appears to be the anchoring of structures in such a way that they survive the summer melt season in their original position. The summer snow of 2002 prevented the vertical instrument supports from melting out but, at the end of the 2003 summer, the instrument supports were severely tilted. This can be avoided by the use of suitable materials to retard or avoid melting around objects implanted in the ice.
Conclusions
The extent and thickness of the ice, and their seasonal and secular variations, are manifest in the amount of thermal energy exchanged in the melting and freezing of the ice. The intrinsic difficulty is that the net amount of heat available for freezing or melting is a small difference between large quantities, primarily the incoming and outgoing streams of solar and infrared radiation. The seasonal cycle of the heat balance responsible for the annual thickness cycle of multi-year ice is relatively large. Good estimates of these seasonal cycles have been established by many field studies over the past half-century.
However, in light of increasing evidence for a secular shift toward a warming climate and a thinning and shrinking sea ice cover, we need to explain these changes in terms of the year-to-year changes of the surface heat balance. Even with the most sophisticated instrumentation and constant attention by observers in situ, these changes have proved to be very difficult to document. Measurements of the individual components of the heat balance have an error of about one per cent, and we need to know the composite, net heat balance to about the same accuracy.
The large difference between the summers of 2002 and 2003 may prove to be serendipitous. Perhaps a thorough analysis of the recorded data for will render a quantitative explanation for the striking difference between the two summers. But even if this should prove infeasible, all data, whether they pertain to the atmosphere or the ocean or the ice, are valuable in their own right, and it remains true that every additional year of observations during the summer represents a large addition to the existing data base.
More Information
The short Arctic summer of 2004
What changes have occurred in Arctic sea ice volume and dynamics over the past 50 years?
North Pole Environmental Observatory
10/10/2003

![]()