
|
|
||
Land - Permafrost |
|||||||||||||||||||||
|
Roads | Permafrost | Tundra | Rivers | Waterfowl | Caribou
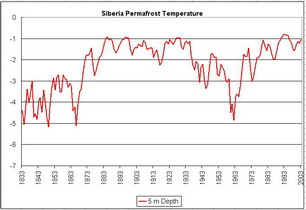
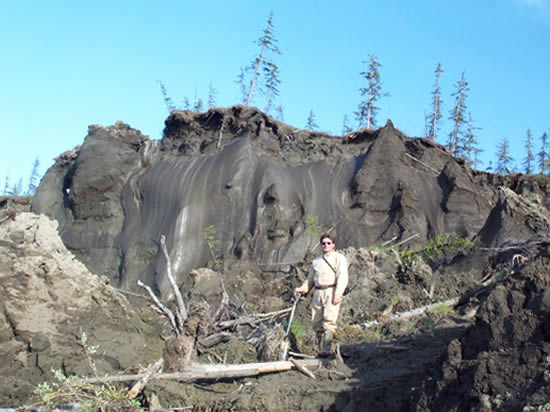
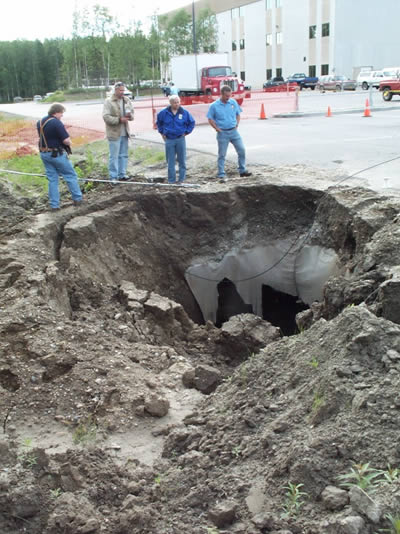
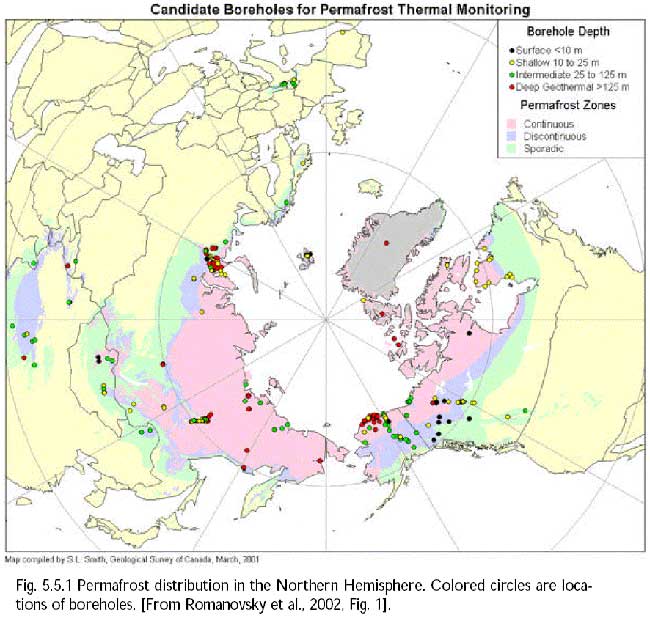
See essays related to permafrost in the Arctic Report Card - Note: In 2014, the Arctic Report Card got a new look that included Permafrost as an Indicator which will be reported every 2-4 years. Therefore this link goes to the table showing Report Card topics by year, which links to the individual essays. Permafrost is permanently frozen ground. For example, in Fairbanks, Alaska, the soil is frozen just some 30 to 40 centimeters below the surface, and in fact, has been frozen for the last several thousand years and maybe even longer. Only the upper 30 to 100 cm of soil (called the active layer) thaws every summer and then completely refreezes during the winter. Typical thickness of permafrost around Fairbanks is about 50 meters, but varies between a few meters and 150 m and more. Permafrost gets colder and thicker northward. On the Alaskan Arctic Plain, permafrost could be as cold as -9 to -11°C cold and up to 650 meters thick. When permafrost degrades (melts), there are impacts on drainage, ground water, river runoffs, ecological systems (such as plants and ponds), release of carbon that has been sequestered in the frozen soil, and infrastructure (such as houses, roads, airports, pipelines, and other facilities based on permafrost). Average temperature during the year is the most important factor for permafrost existence. Permafrost temperatures at 1 m below ground in central Alaska have been warming since the 1960s and were reaching near to the melting point in the mid-1990s. There has been a retreat to colder temperatures (less than -1°C) in the last few years.
Find more information (references and websites):
|
|||||||||||||||||||||
| About | http://www.pmel.noaa.gov/arctic-zone/detect oar.pmel.arctic.webmaster@noaa.gov DOC | NOAA | PMEL | Arctic Zone | Arctic Change Detection Privacy Policy | Disclaimer |
![Time series of annual permafrost temperatures (b and c) measured from north to south across Alaska (a) in the continuous and discontinuous permafrost zones. [From V. Romanovsky]](detection-images/land-permafrost-2012.jpg)