|
Sea Ice | North
Pole Observations | Glaciers | Snow
Cover
See annual updates on Greenland from the latest Arctic Report Card
See essays related to Glaciers & Ice Caps in the Arctic Report Card - Note: In 2014, the Arctic Report Card got a new look that included Glaciers Outside Greenland as an Indicator which will be reported every 2-4 years. Therefore this link goes to the table showing Report Card topics by year, which links to the individual essays.
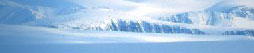
Glaciers are different from sea ice in that they are regions of fresh
water ice on land. Their retreat and loss of volume is an indicator of
Arctic change. Annual climatic mass balance was negative at 21 of 24 Arctic glaciers monitored in 2010-2011.
 |
|
 |
| |
|
|
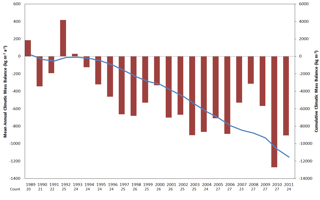
| Mean annual (red) and cumulative (blue) climatic mass balance (Bclim) from 1989-2011 based on all available annual measurements (count) from Arctic glaciers reported to the World Glacier Monitoring Service by January 2013. Each year during this period has at least 20 reported measurements. See Arctic Report Card 2013. |
|
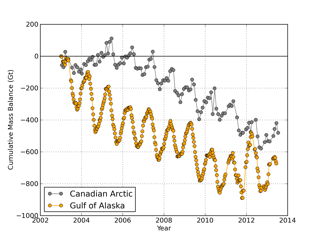
Cumulative total mass balances of Canadian Arctic and Gulf of Alaska region glaciers, determined by GRACE satellite gravimetry. Canadian data are estimates from monthly Stokes coefficients from the Center for Space Research fifth release (CSR RL5) and processed following methods in Gardner et al. (2011) and Wouters and Schrama (2007). The Gulf of Alaska data are processed according to Luthcke et al. (2013) and subsetted to the region defined in Arendt et al. (2013). See Arctic Report Card 2013. |
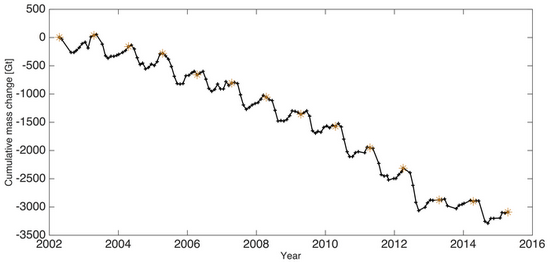
The Greenland ice cap represents a major storage of frozen fresh water
on land. Shown below is the cumulative change in mass and the average summer surface albedo for the Greenland Ice Sheet.
 |
|
 |
| |
|
|
| Cumulative change in the total mass (in Gigatonnes, Gt) of the Greenland Ice Sheet between April 2002 and April 2015 estimated from GRACE measurements. Each symbol is an individual month and the orange asterisks denote April values for reference. See Arctic Report Card 2015. |
|
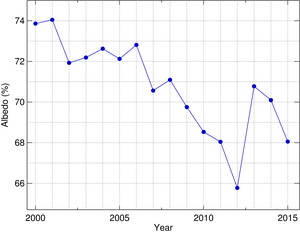
Average surface albedo of the entire ice sheet each summer (JJA) since 2000. The period 2000-2009 is used as reference to be consistent with previous Arctic Report Card albedo reports. See Arctic Report Card 2015. |
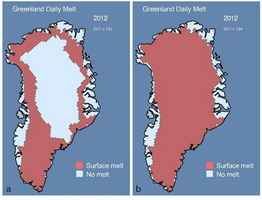
As of 2004, the year 2002 had the maximum yearly melt in the observational
record, as shown below. A rare melt event impacting 97% of the ice sheet surface was detected by satellites in July 2012.
 |
|
 |
|
 |
| |
|
|
|
|
| Time Series (1979-2002) of maximum summer
melt extent over Greenland (left) and examples of the melt extent
during 1992 and 2002 (right). 2004 was not as extreme as 2002. (Images
courtesy of Konrad Steffen and Russell Huff, CIRES, University of
Colorado at Boulder). From NSIDC and NASA, see http://earthobservatory.nasa.gov/Study/vanishing/. |
|
Surface melt extent on the Greenland Ice Sheet on 1 July 2012 (a) and 12 July 2012 (b) detected by the SSM/I passive microwave sensor. Figure is after Tedesco et al. (2007). See Arctic Report Card 2012. |
|
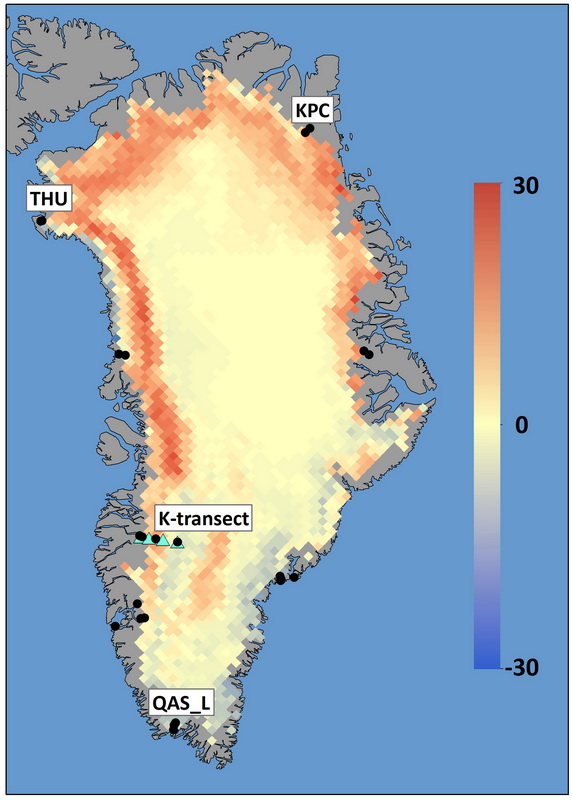
Map of the anomaly (with respect to the 1981-2010 average) of the number of days when melting was detected in summer 2015. See Arctic Report Card 2015. |
Find more information (references and websites)
- Repeat photographs of Alaska Glaciers from the National Snow and Ice Data Center
- AAAS News Release New Study in Science Warns of Greenland’s Accelerating Glaciers, (16 February 2006).
- Dyurgerov, M. B. and Dwyer, J. D., 2001: The steepening of glacier
mass balance gradients with northern hemisphere warming. Zeitschrift
fur Gletscherkunde und Glazialgeologie, 36 (2000), s. 107-118.
- Steffen, K., S. V. Nghiem, R. Huff, and G. Neumann (2004), The
melt anomaly of 2002 on the Greenland Ice Sheet from active and passive
microwave satellite observations, Geophys. Res. Lett., 31, L20402,
doi:10.1029/2004GL020444.
- "Arctic
glacier photos show less ice, snow after 45 years", Anchorage
Daily News, September 26, 2004. See photos
of Arctic Glacier in 1958 and 2003.
|