North Pole Weather Data from 2004 Deployment
In April 2004, PMEL deployed instrumentation and two web cams on an ice floe at the North Pole. The weather data from this instrumentation will continue to be reported here as the ice floe drifts southward.
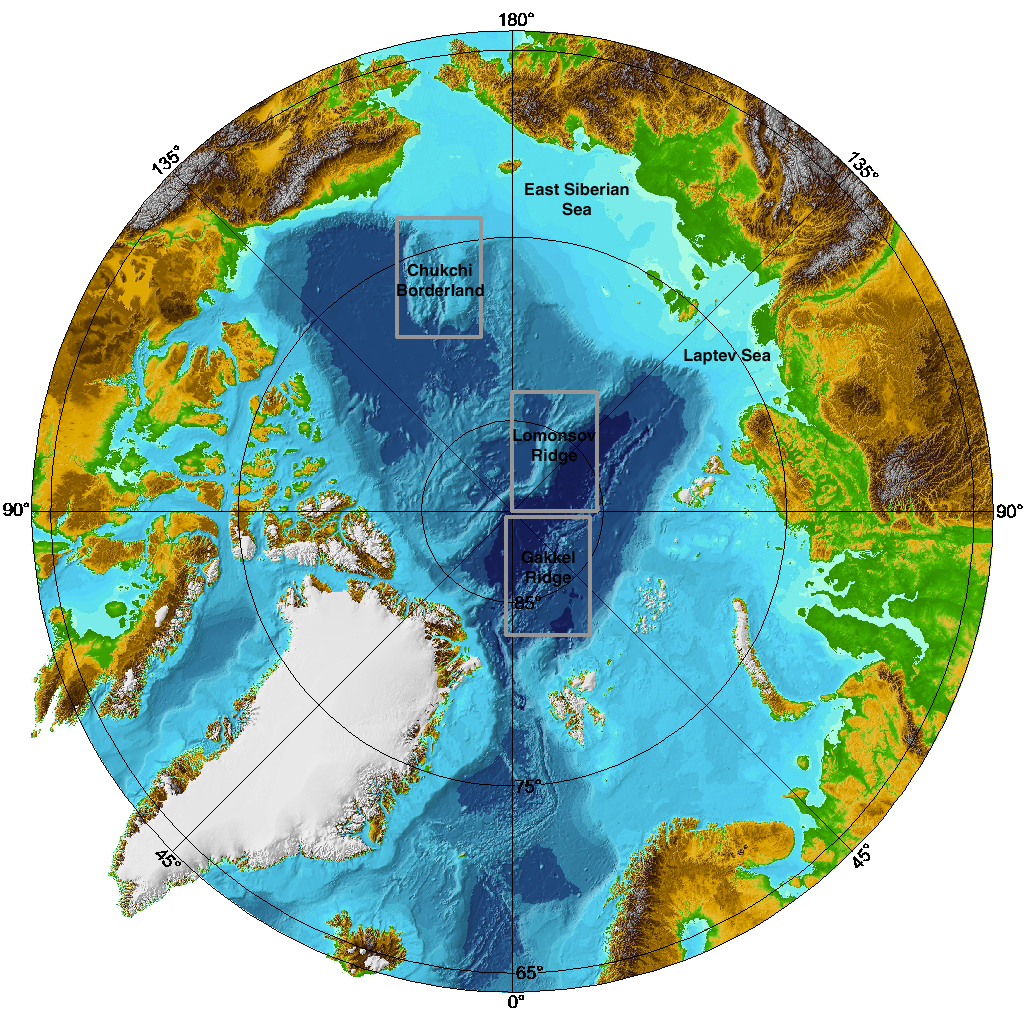
· What is the Lomonosov Ridge? |
NOAA/PMEL instrumentation and web cams are typically deployed at the North Pole Borneo site, on the European side of the Lomonosov ridge. In April 2003, the NOAA weather station, ice-temperature buoy, two radiometers and two web cams were deployed at the Borneo site, and one ice-temperature buoy was deployed at the JAMSTEC site, on the Alaska side of the Lomonosov ridge. Both North Pole Web Cams are at the Borneo site. Web Cam #1 looks at the Ice-temperature buoy, and Web Cam #2 looks at the meteorological station.
Weather data plot
Ice-temperature plot
Map of station drift
Weather plot: This plot presents incoming short-wave solar radiation measured by one of the radiometer buoys, along with air temperature, air pressure, and winds measured by the meteorological station. (Note: The radiometer station is now tilted by 20 degrees, and we have not attempted to correct for the tilt. In addition, the radiometers may now be shaded by the solar panels at some sun angles.)
Download preliminary data: 22203_plot.wx 21076_roger.rad (Here is header information for these files).

Latest data (updated approximately weekly)
![]()
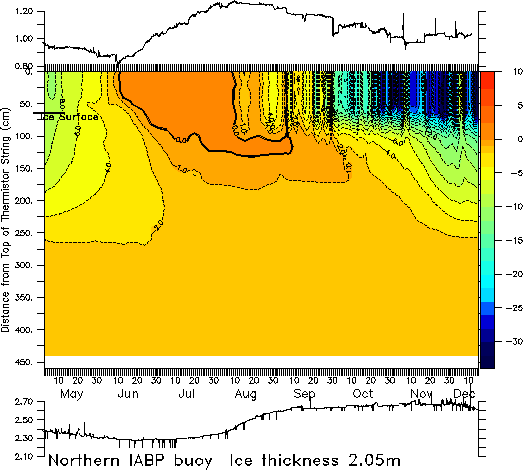
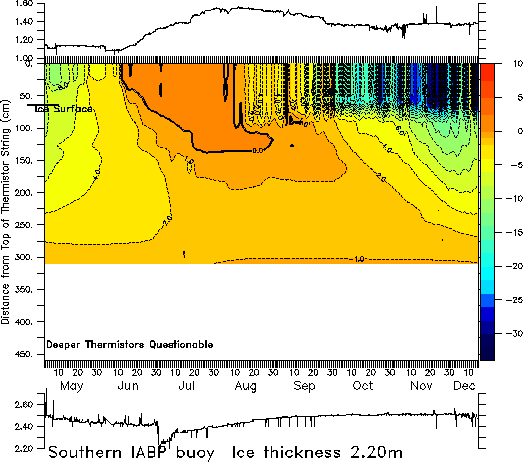
Ice-temperature plot: Plots of air, ice, and ocean temperature as measured by Mass Balance buoys developed by CRREL. The buoys at the Borneo and JAMSTEC sites were funded through PMEL, and the IABP buoys were funded by the International Arctic Buoy Program at APL.
We plot the snow-pinger data above the contour and the underwater pinger data below the contour. The pingers are instruments which measure their distance from a solid surface - the snow or ice. They therefore show how much snow and ice are being melted from (or added to) the upper and lower surfaces of the ice.
Download preliminary ice-temperature data (Borneo): 07100.cplot 07100.ping (Here is header information for this file) Buoy 07100 at Borneo stopped transmitting on December 8, 2004.

Download preliminary ice-temperature data (JAMSTEC): 07105.cplot 07105.ping (Here is header information for these files.) Buoy 07105 at JAMSTEC stopped transmitting on February 6, 2005.

Latest data (updated approximately weekly)
![]()
Map of station drift: Drift of the North Pole station since its deployment in April. Station location is derived from the Global Positioning System (GPS). Positions shown are from the PMEL buoys at the Borneo site and the JAMSTEC site, and from the CRREL buoys deployed by the International Arctic Buoy program (IABP-1 and IABP-2).

Latest data (updated approximately weekly)
Click here to calculate sunrise/sunset times for any location on the earth.
![]()
| • Web cam Home and Acknowledgments | |
| • Daylight and Darkness at the North Pole | |
A similar deployment was made in April 2002, one year earlier. Although the ice floe has drifted southward, and the 2002 web cam stopped operating with the onset of winter cold and darkness in fall 2002, the instruments from the 2002 deployment were still reporting as of April 2003, and the data is available on the North Pole Weather Data from 2002 Deployment.
| The North Pole Web Cam is part of the North Pole Environmental Observatory, a joint National Science Foundation-sponsored effort by the Polar Science Center, / APL / UW, the Pacific Marine Environmental Laboratory / NOAA, the Japan Marine Science and Technology Center, Oregon State University, and Cold Regions Research and Engineering Laboratory. |