 |
||
| Home | Daily Log | About the Research | Images and Video | Maps | Data | Q&A | Links | ||

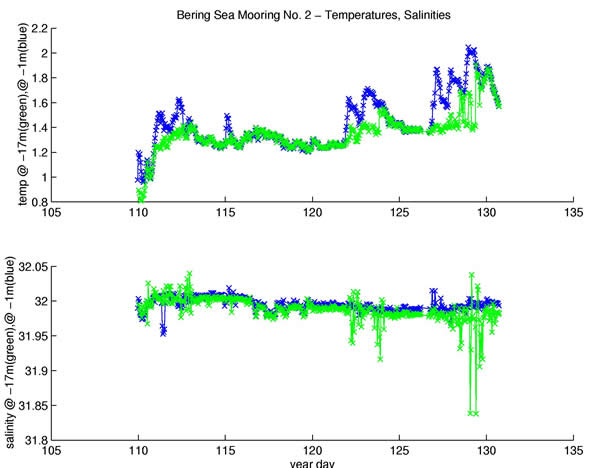
Bering Sea-Ice Edge Expedition Data - Mooring Site 2 Temperature and Salinity |
||
|
|
||
| Privacy | Disclaimer | Accessibility | Contact Us |
|
|
||
| Home | Daily Log | About the Research | Images and Video | Maps | Data | Q&A | Links | ||
|
Bering Sea-Ice Edge Expedition Data - Mooring Site 2 Temperature and Salinity |
||
|
|
||
| Privacy | Disclaimer | Accessibility | Contact Us |