Long-Term Uplift Rates
This page displays long-term rates of uplift or subsidence, calculated using data from the Bottom Pressure Recorders (NANO-BPR) on the BOTPT instruments at Axial Seamount, part of the National Science Foundation's (NSF) Ocean Observatories Initiative (OOI) Cabled Array seafloor observatory, operated by the University of Washington. The dates/times below are in GMT (+8 hrs of local standard time, or +7 hrs of DLS time on the US west coast). Note the long-term rates were reset after the April 2015 eruption.
The 12-week uplift rate from the Central Caldera (MJ03F, 1st plot below) is used on the Forecasting - Method #1 page. However, we have another forecasting method that is probably better on the Forecasting - Method #2 page, which used the Rate of Differential Uplift between stations MJ03F and MJ03E. This removes the "noise" from tidal residuals and oceanographic effects and provides a clearer representation of the volcanic inflation signal.
LINK BACK TO MAIN PAGE
Long-Term Uplift Rates (post-2015-eruption re-inflation)
The plots below show the long-term rates of depth change, from each of the four BOTPT instruments, calculated from 1-day means of the de-tided NANO-BPR data over time. There is a pair of plots for each of the four BOTPT instruments, showing the most-recently calculated long-term rates, and also how these rates have varied with time. The first set of plots shows re-inflation since the April-May 2015 eruption and are updated once a day.
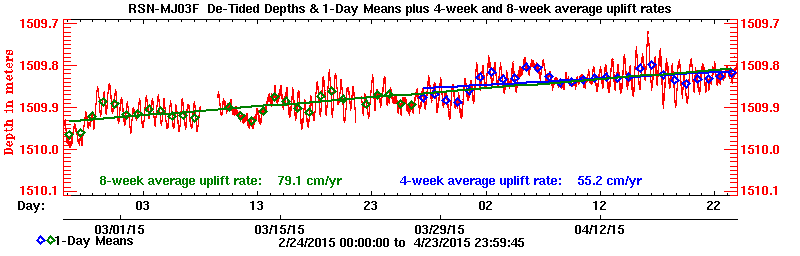
BOTPT-A301-MJ03F - Central Caldera
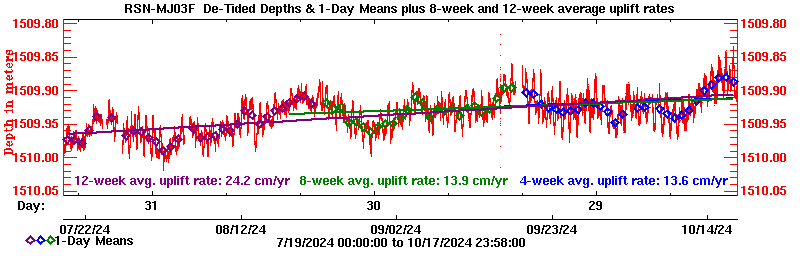
Plot 1: Plot of long-term rates of depth change calculated from the last 4-weeks, 8-weeks, and 12-weeks.
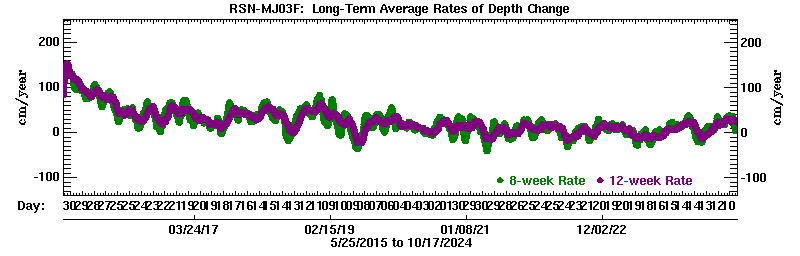
Plot 2: Plot of how the long-term rates have varied over time, since 25 May 2015.
BOTPT-A302-MJ03E - Eastern Caldera
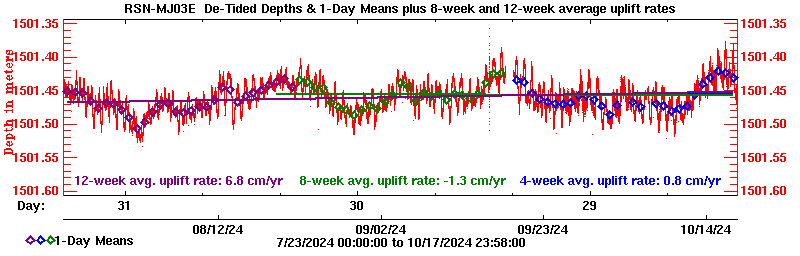
Plot 3: Plot of long-term rates of depth change calculated from the last 4-weeks, 8-weeks, and 12-weeks.
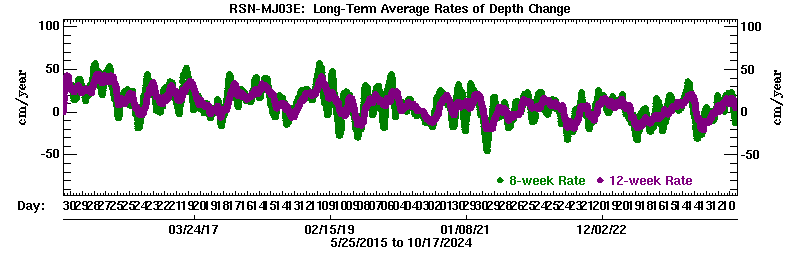
Plot 4: Plot of how the long-term rates have varied over time, since 25 May 2015.
BOTPT-A303-MJ03D - International District
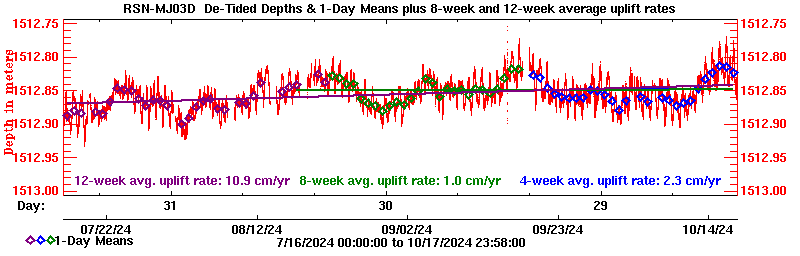
Plot 5: Plot of long-term rates of depth change calculated from the last 4-weeks, 8-weeks, and 12-weeks.
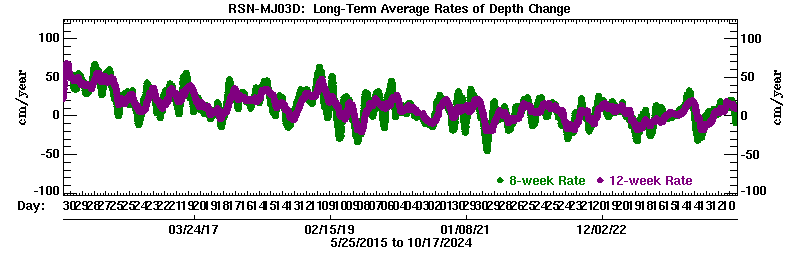
Plot 6: Plot of how the long-term rates have varied over time, since 25 May 2015.
BOTPT-A304-MJ03B - ASHES Vent field (deployed mid-August 2017)
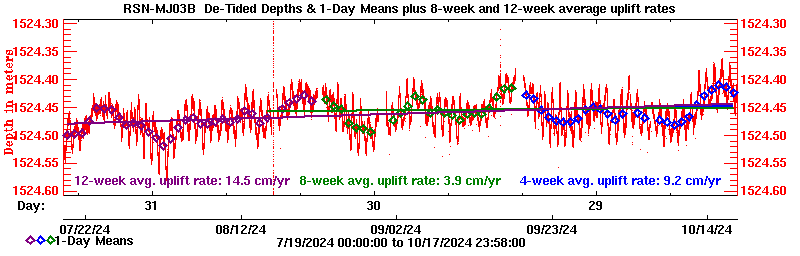
Plot 7: Plot of long-term rates of depth change calculated from the last 4-weeks, 8-weeks, and 12-weeks.
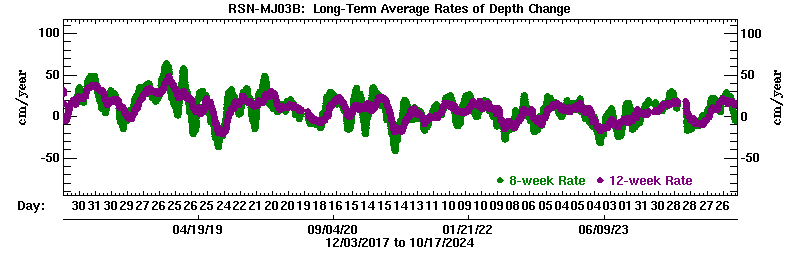
Plot 8: Plot of how the long-term rates have varied over time, since 03 Dec 2017.
Long-Term Rates - 25 April to 05 May 2015 ONLY (co-eruption subsidence)
The plots below show the rate of subsidence from 25 April to 05 May 2015 ONLY, from each of the three BOTPT instruments, calculated from 1-day means of the de-tided NANO-BPR data. Note these plots do not show the majority of the subsidence, which occurred on 24 April 2015 (those data are shown HERE). These plots are static (not being updated).
BOTPT-A301-MJ03F - Central Caldera - 25 April to 05 May 2015 ONLY
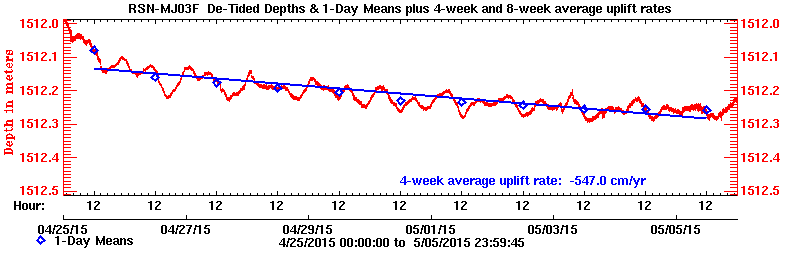
Plot 9: Plot of long-term rates of depth change calculated from 25 April to 05 May 2015.
BOTPT-A302-MJ03E - Eastern Caldera - 25 April to 05 May 2015 ONLY
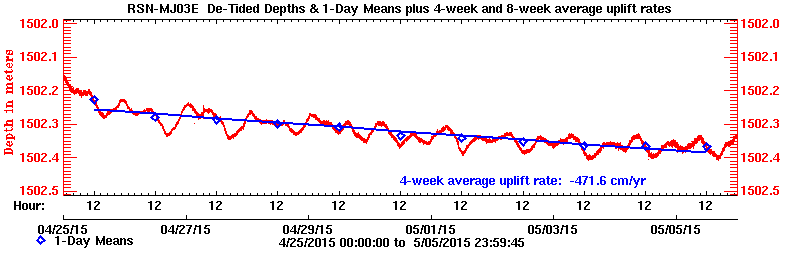
Plot 10: Plot of long-term rates of depth change calculated from 25 April to 05 May 2015.
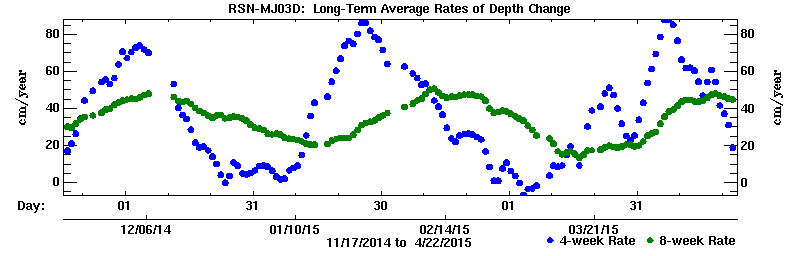
BOTPT-A303-MJ03D - International District - 25 April to 05 May 2015 ONLY
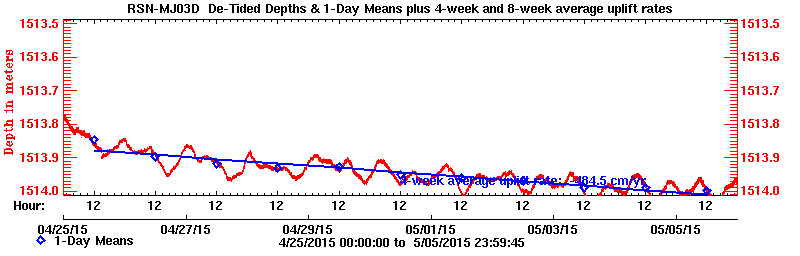
Plot 11: Plot of long-term rates of depth change calculated from 25 April to 05 May 2015.
Long-Term Rates - BEFORE 24 April 2015 ONLY (pre-eruption inflation)
The plots below show the long-term rates of depth change, from each of the three BOTPT instruments, calculated from 1-day means of the de-tided NANO-BPR data over the 4- and 8-weeks BEFORE the 24 April 2015 eruption. There are two pairs of plots for each of the three BOTPT instruments (using PRE 24 April 2015 data only), showing the calculated long-term rates, and also how these rates varied with time. These PRE 24 April 2015 plots are static. NOTE: in the plots below, the NANO-BPR data were de-tided using the OSU tpxo72-2010 global tide model output from SPOTL software. We no longer use SPOTL for de-tiding the real-time BPR data.
BOTPT-A301-MJ03F - Central Caldera - BEFORE 24 April 2015 ONLY
Plot 12: Plot of long-term rates of depth change calculated from the last 4- and 8-weeks, before 24 April 2015.
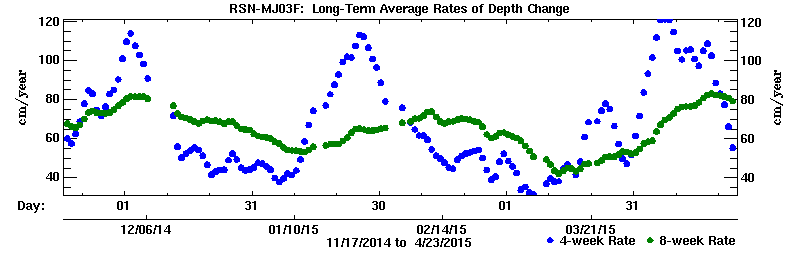
Plot 13: Plot of how the long-term rates have varied over time, before 24 April 2015.
BOTPT-A302-MJ03E - Eastern Caldera - BEFORE 24 April 2015 ONLY
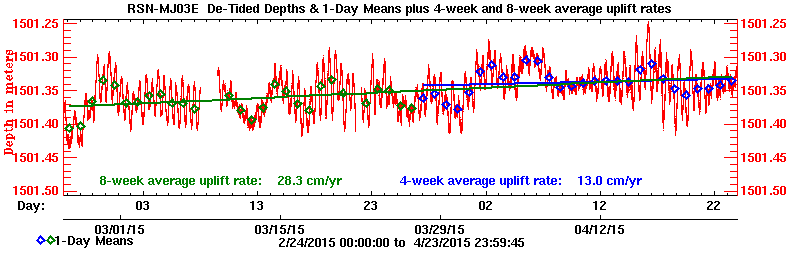
Plot 14: Plot of long-term rates of depth change calculated from the last 4- and 8-weeks, before 24 April 2015.
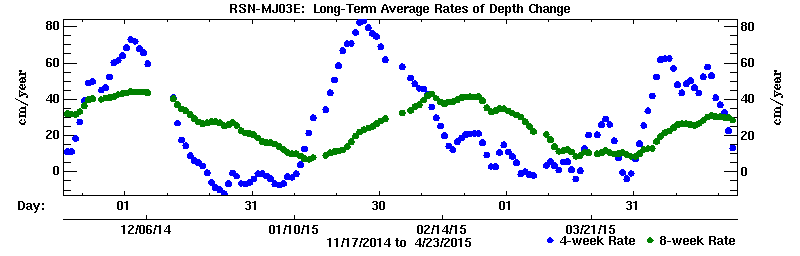
Plot 15: Plot of how the long-term rates have varied over time, before 24 April 2015.
BOTPT-A303-MJ03D - International District - BEFORE 24 April 2015 ONLY
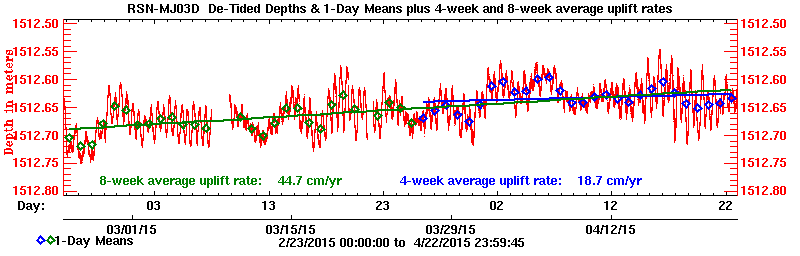
Plot 16: Plot of long-term rates of depth change calculated from the last 4- and 8-weeks, before 24 April 2015.
Plot 17: Plot of how the long-term rates have varied over time, before 24 April 2015.
More information
National Science Foundation | The Ocean Observatories Initiative | Cabled Array Observatory
Required OOI disclaimer: This is provided as pre-commissioned data intended for scientific use, and is subject to the OOI Data Policy. This data has not been through Quality Assurance checks.
Required NSF disclaimer: This material is based upon work supported by the National Science Foundation. Any opinions, findings, and conclusions or recommendations expressed in this material are those of the author(s) and do not necessarily reflect the views of the National Science Foundation.