In Anomalies
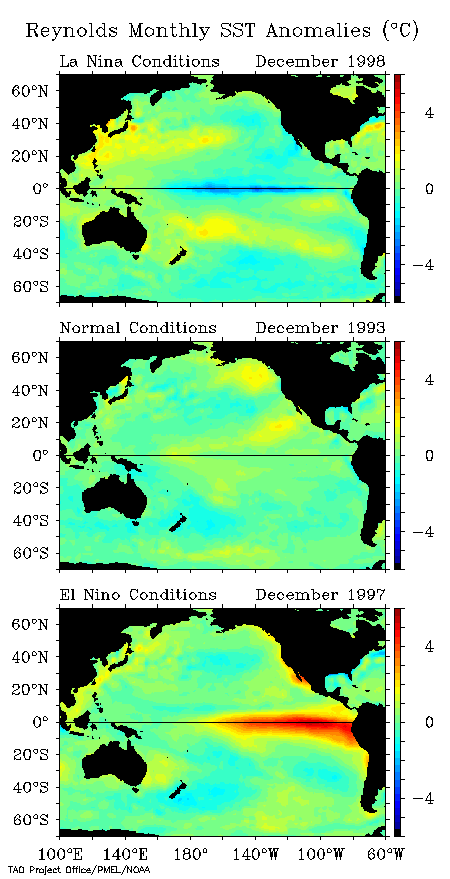
How are La Niña, El Niño and Normal conditions seen in Anomalies (deviations from normal) of Pacific Ocean Surface Temperatures?

The three panels in this graphic show ocean surface temperature anomalies (deviations) for the entire Pacific Ocean (70ºN to 70ºS).
La Niña (December 1998, top panel) has cold (blue) temperature deviations along the equator in the eastern and central Pacific.
Normal conditions (December 1993, middle pannel) have neutral temperatures along the equator.
El Niño (December 1997, bottom panel) is characterized by the unusual warm temperatures deviations (red) in the eastern and central Pacific.
Credits
The graphic of Sea Surface Temperature Deviations from Normal throughout the Pacific Ocean shows data obtained from the National Center for Environmental Prediction (NCEP). The graphics are provided by the TAO project and created by Dai McClurg.


