I tried to make my own example, but I don't see this behavior; what version of Ferret
are you running, and what machine?
If you run this script, do you see the problem:
use etopo60
def axis/x=0:360:2.5/modulo/units=degrees xc
def axis/y=-90:90:2.5/modulo/units=degrees yc
let myvar = rose[gx=xc,gy=yc]
save/clobber/file=myvar.nc myvar
can data/all
can var/all
use myvar
go mp_stereographic_north 0 90; set grid myvar
go mp_aspect
set reg/y=47.5:90
shade myvar, x_page, y_page
go mp_graticule 0 360 90 50 90 10
set reg/y=50:90
shade myvar, x_page, y_page
go mp_graticule 0 360 90 50 90 10
list y[gy=myvar]
Muyin Wang wrote:
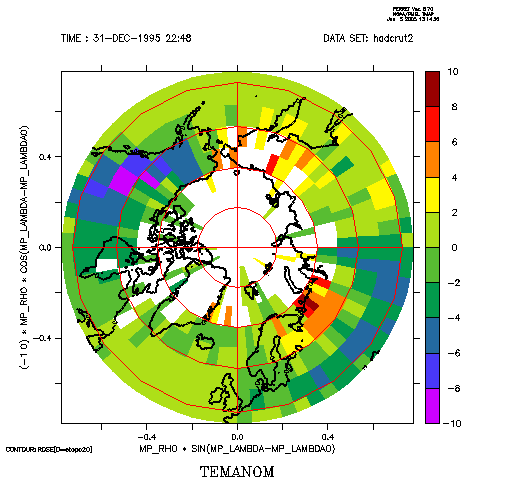
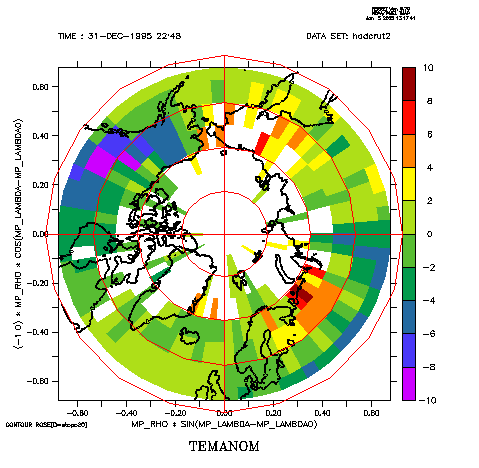
Hello,
I have been trying to plot shaded plots over polar stereographic
projection using
go mp_stereographic_north 0 90; set grid myvar
shade myvar,x_page,y_page
go mp_graticule 0 360 90 50 90 10

It seems that ferret always plot the outside grid box in half no matter
how do I define the region, regardless the underlying grid box.

Attached 2 figures are based on CRU SAT data (5x5 degree resolution), and
the first one was created by
def region/y=47.5:90,
while the 2nd one was created by
set region/y=50:90n

I also tried using NCEP Reanalysis data for a similar test. Unfortunately,
ferret does the same thing: the most outside of the domains are shaded by
half of the grid box (NCEP's grid box is 2.5x2.5).

How could I get the full grid shaded in this map projection?
Thanks