It turns out that this is because the map projection scripts call the curvilinear
SHADE command with the mapping variables computed based on the coordinates,
and what we'd prefer here is to have the coordinates computed using the cell
edges. Here's the bit from the Users Guide (see SHADE, curvilinear version in the
index)
...
2. In the 3-argument SHADE syntax you can specify either the
coordinates
of the points or the coordinates of the cell boundaries. In the
command
yes? SHADE values, xcoords, ycoords
say that nVx is the size of the "x" dimension of the values
argument, and
nCx is the size of the "x" dimension of the coordinate arguments.
If nCx = nVx then the xcoords argument is presumed to give the
locations
of the points in the values argument and (as you say), the
boundaries between
points are computed to be the midpoints.
However, if nCx = nVx + 1 then the xcoords and
ycoords arguments are
presumed to give the locations of the boundaries. For an example see
the
FAQ on Using
the 3-argument SHADE command. In all cases the size
of the xcoords argument must match the size of the ycoords argument.
the edges instead. This would be easy if we had a pseudo-variable with the
x and y edges - something that's on our list of things to do but which we haven't
yet got.
Muyin Wang wrote:
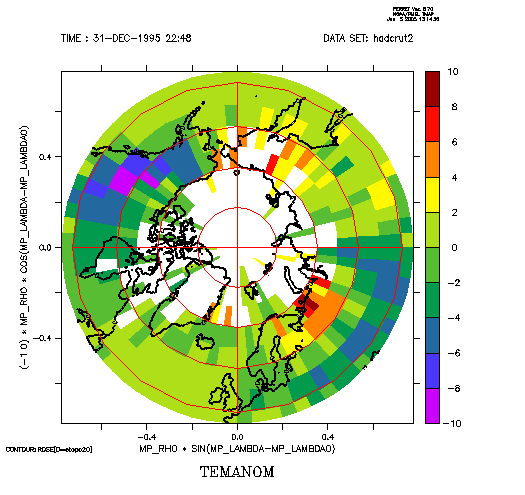
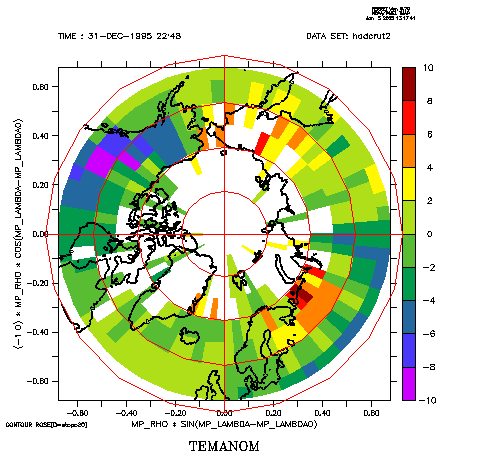
Hello,
I have been trying to plot shaded plots over polar stereographic
projection using
go mp_stereographic_north 0 90; set grid myvar
shade myvar,x_page,y_page
go mp_graticule 0 360 90 50 90 10

It seems that ferret always plot the outside grid box in half no matter
how do I define the region, regardless the underlying grid box.

Attached 2 figures are based on CRU SAT data (5x5 degree resolution), and
the first one was created by
def region/y=47.5:90,
while the 2nd one was created by
set region/y=50:90n

I also tried using NCEP Reanalysis data for a similar test. Unfortunately,
ferret does the same thing: the most outside of the domains are shaded by
half of the grid box (NCEP's grid box is 2.5x2.5).

How could I get the full grid shaded in this map projection?
Thanks