
 |
| Home | Daily Log | About the Research | Images and Video | Maps | Data | Q&A | Links |

Bering Sea-Ice Expedition Maps |
|
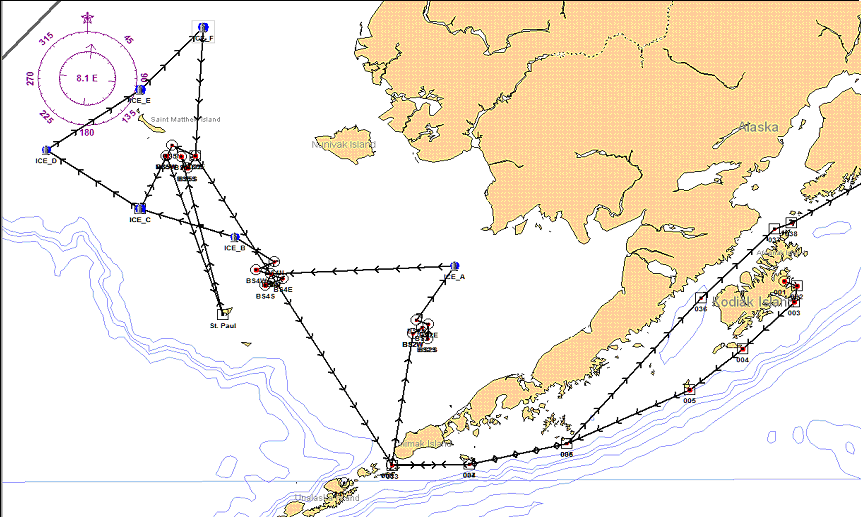
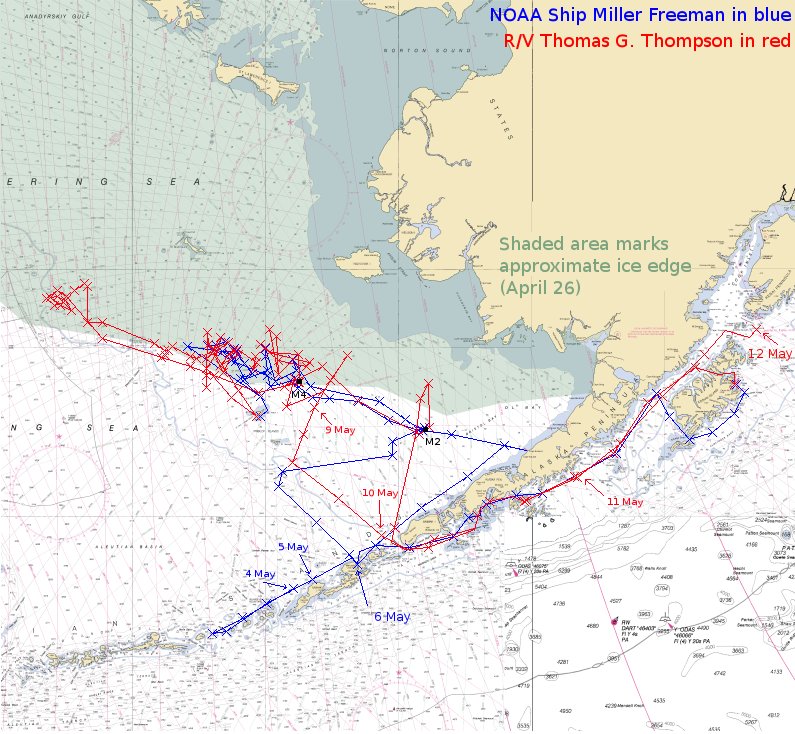
Maps and nautical charts, are an important part of ocean navigation and exploration. Here are a few ways we use maps for navigation and data analysis:
|
|
Shown below is a set of maps showing the Bering Sea and location in the North Pacific region, and on our globe. The zoomed-in view of the Bering Sea (below, click for larger image) shows geographic place names and bodies of water. 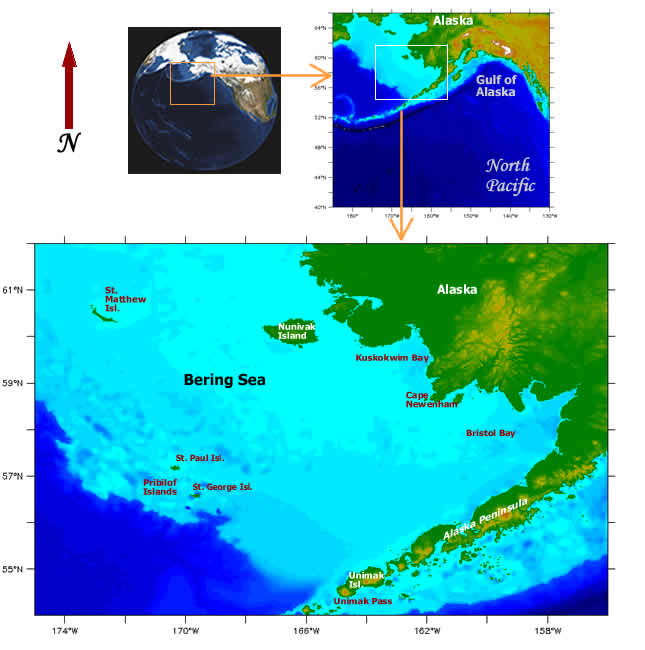
|
| Privacy | Disclaimer | Accessibility | Contact Us |