Ongoing Volcanic Seismicity on the Gorda Ridge
- Event Plume Temperature Cross-Section
- Event Plume Helium-3 Results
- Event Plume Particle Results
- Event Plume Dissolved Chemistry Results
- Seafloor Geology Results
PRELIMINARY SCIENTIFIC RESULTS
The results posted below are (of course) preliminary and subject to revision as more data is analyzed.
Plume Temperature Anomaly Cross-section
Ed Baker, NOAA/PMEL, 3/18/96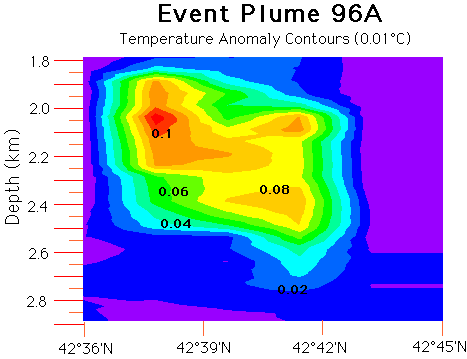
This graphic shows a north-south slice through the event plume(s) discovered on the Gorda Ridge on March 10-11, 1996. The contours are based on five vertical casts evenly spaced between 42 36' and 42 43'N. "Temperature anomaly" is the increase in water temperature above that expected for a given density horizon in the absence of hydrothermal activity. An east-west transect looks similar. Since previous event plumes have been characterized by horizontal and vertical symmetry about a central core, the structure in this feature suggests an agglomeration of two or more distinct events that discharged separate plumes. These events could have been separated in space and/or time. The location of such events on the seafloor is unknown. (Ed Baker, NOAA/PMEL)
Preliminary results from the NOAA/PMEL Helium Isotope Group
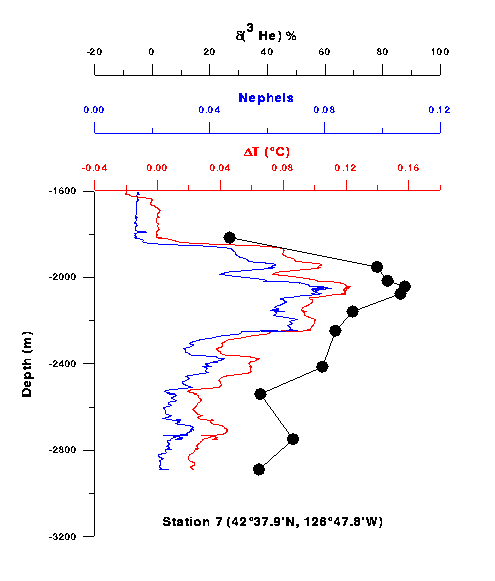
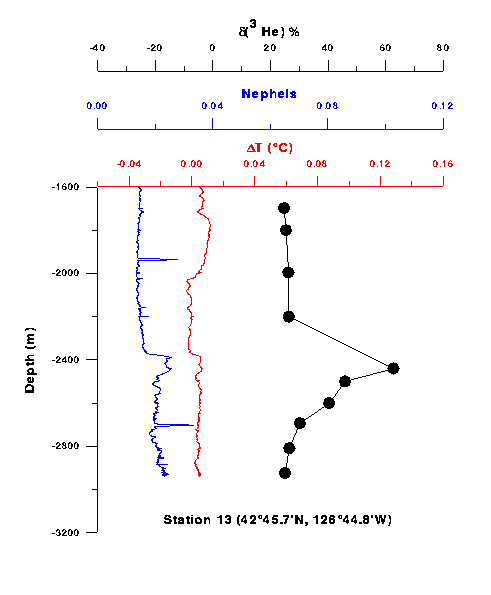
(John Lupton, Ron Greene, Leigh Evans, Richard Kovar)Shown below are two depth profiles of delta (helium-3), nephelometer data (suspended particles), and temperature anomaly for stations 7 and 13 from the recent Gorda Ridge expedition of the NOAA Ship McArthur. Delta (helium-3) is simply the percentage enrichment of the rare isotope of helium, 3He, above the normal values. Helium-3 is of interest because it is enriched in the Earth's interior, and is also enriched in fresh oceanic volcanic rocks and in submarine hydrothermal fluids. Thus the presence of helium-3 in the ocean water column is an unambiguous indicator of hydrothermal input into the ocean. Helium-3 also has the advantage of being a completely stable, conservative tracer which is not affected by chemical or biological processes.
Station 7 was the first station to detect the presence of an event plume of megaplume in the water column. The profile at this station has high enrichments in nephelometer and temperature anomaly and also shows high enrichments in helium-3 as expected. We analyzed the station 13 profile as a "background" profile, and expected it to be devoid of any strong helium signal s. Surprisingly, the profile has a strong helium-3 maximum at 2488 m depth associated with a relatively weak blip in the nephels and temperature anomaly.
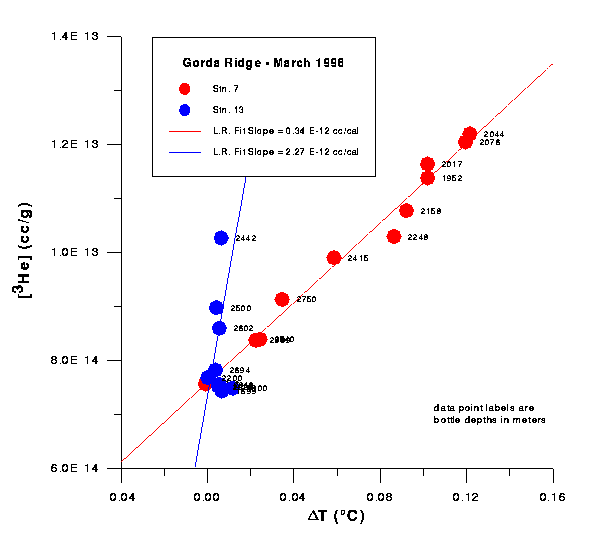
The plot of helium-3 concentration versus temperature anomaly for stations 7 and 13 shows that these two stations sampled water-column plumes with much different ratios of helium-3/heat. The helium-3/heat trend for station 7 (the event plume) has a relatively flat slope of 0.34E-12 cc/cal similar to other event plumes detected in 1986 and 1993 over the Juan de Fuca Ridge. In contrast, the plume detected at station 13 has a much higher helium-3/heat trend of 2.27E-12 cc/cal. This difference in the helium-3/heat ratio for the event plumes versus the deeper, steady-state plumes is similar to that observed previously in 1986 and 1993. See Lupton et al., Nature, 337, 161-164, 1 989; Baker and Lupton, Nature 346, 556-558, 1990; Lupton et al., Geophysical Research Letters, 22, 155-158, 1995.
Preliminary results from particle studies
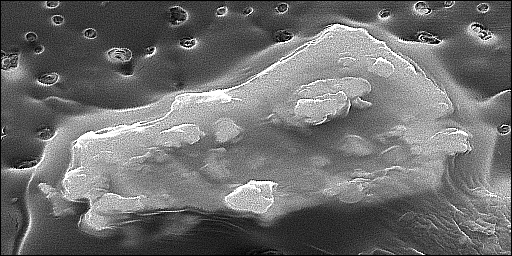
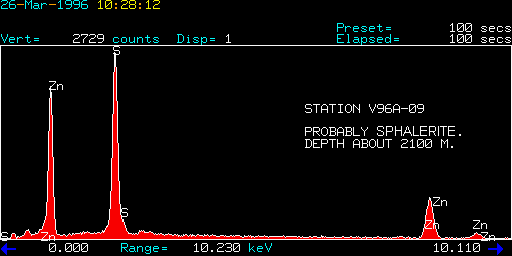
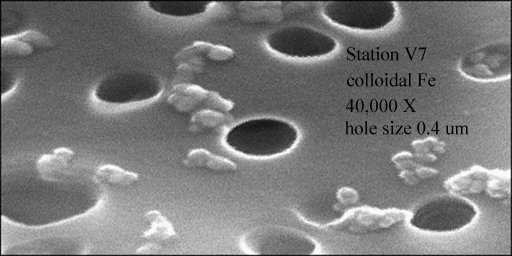
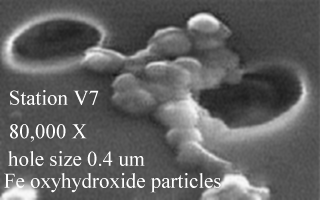
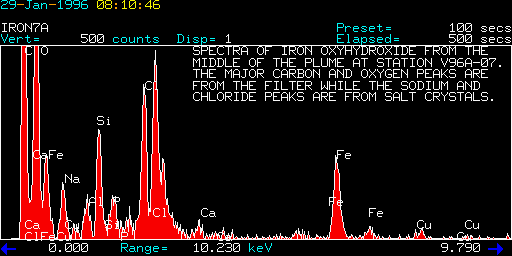
Dick Feely, NOAA/PMELWe have been conducting the SEM analysis of the first sample from the Megaplume site at GR-14. We have seen Fe oxides, Zn sulfides and what appears to be bacterial aggregates(we're not sure yet). The Fe oxides are in two distinct forms. One form contains Phosphorus and the other does not. Perhaps we are seeing Fe oxides that are formed subseafloor (no phosphorus) and within the megaplume (enriched in phosphorus). The Zn sulfides are very pure (i.e., no Fe). This sample appears to be similar to the plume samples we saw over the flow site in 1993. The SEM images that Geoff Lebon is getting are very clear, but the traffic outside the lab is affecting the photomicrographs.
(3/22/96, 1400PST)
Preliminary results from dissolved chemistry studies
Gary Massoth, NOAA/PMEL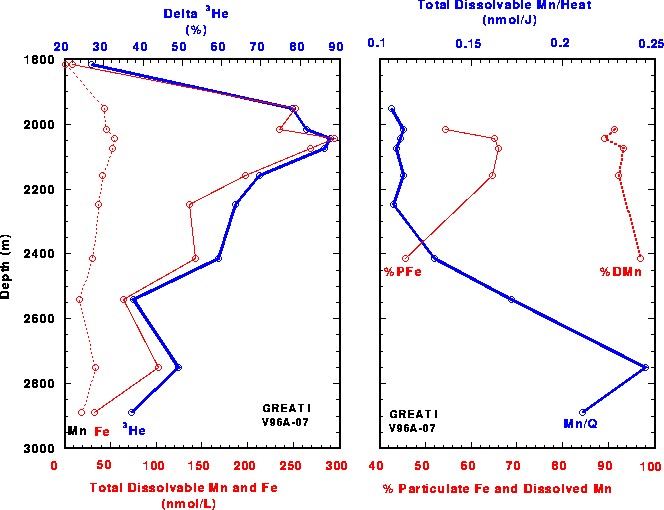
The left panel shows vertical distributions of total dissolvable Mn and Fe superimposed on the 3-He distribution (courtesy Dr. John Lupton). Note the striking correspondence in profile shape and also the enrichment of Fe relative to Mn. A smaller deep plume maximum is also evident.
The right panel shows the distribution of Mn/heat (Mn/Q) for the event plume and the deeper plume at station V7. Based on this distribution, the two plume types can be differentiated as "event" and "chronic" types, with Mn/heat signatures characteristic of these style plumes sampled at the North Cleft and CoAxial segments on the Juan de Fuca Ridge (Massoth et. al., J. Geophys. Res., 99(B3), 4905-4923, 1994; Massoth et. al., Geophys. Res. Lett., 22(2), 151-154, 1995). Also shown are the phase abundances of particulate Fe (relative to total Fe) and dissolved Mn (relative to total Mn). The phase fractions for particulate Fe are among the lowest sampled in the NEPAC and indicate a very young event plume was sampled.
(8/9/96)
Kevin Rowe has just finished determining the dissolved and total dissolvable concentrations of Mn and Fe in some of the samples from the first "hit" on the Gorda Event Plume, and also from an experiment we conducted at sea to determine the phase transition rate for Fe. Although we do not have enough data yet to be certain of conclusions, it appears that we sampled the event plume soon after it was formed or even as it was forming. This timing is inferred not only from the somewhat uneven structure of the physical sensor property distributions seen for V96A07 but is supported by the Fe results. Approximately (ONLY!) 46% of the Fe was in the particulate phase for a sample collected at 2415 m on this cast. (56% combining with Dick Feely's preliminary PFe data.) This compares to PFe fractions of 55%, 84%, and 96% for the CoAxial Event Plumes. The youngest plume at CoAx (55% PFe) was Fe-aged at 1.8 to 2.7 days old. Recent experiments to improve on the Fe clock (conducted during the '95 DISCOVERER Leg I VENTS cruise) suggest that the CoAx Fe ages were likely maxima. We will have the results soon for an experiment conducted while on the McARTHUR to determine the rate explicitly for Gorda event plume waters. Preliminary results from that experiment support the very young plume age.The Fe to Mn ratio for this plume is about 4, similar to the two older plumes sampled at CoAx and about half the value for the youngest event plume sampled there. Perhaps there is more to come in the way of Fe emissions at Gorda?
I hope to be able to combine our dissolved results with Ed Baker's dT values and Dick Feely's PFe data next week to provide a more complete picture of how the Gorda Fe and Mn emissions compare to what we have seen previously at North Cleft and CoAxial Segments.
(3/25/96)
Seafloor Geology Results
Bob Embley, Bill Chadwick, NOAA/PMEL, 4/18/96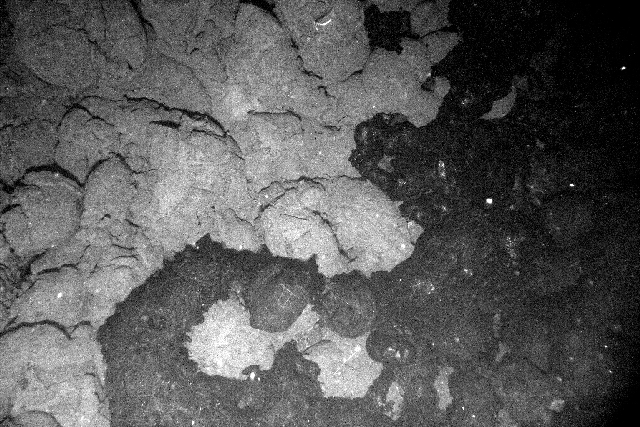
Above is a digital camera image (reduced 50%) collected from the R/V WECOMA showing the contact between the new lava flow at Gorda and the surrounding older lava. The eruption site is at least 3.5 km long and only about 100-200 m wide, based mainly on the distribution of near-bottom temperature anomalies above the cooling flow (we haven't developed all the 35 mm film yet). With this shape, the flow is clearly the product of a brief fissure eruption, where a dike reached the surface. The lava flow is located directly under the Event Plume mapped by CTD casts during the McArthur cruise. The image was taken by a Benthos digital camera developed for Woods Hole Oceanographic Institution (Dan Fornari, P.I.)
Bottom Imaging Team on WECOMA GREAT II Cruise
Bob Embley-- NOAA/PMEL
Bill Chadwick-- Oregon State University/NOAA
Tim Shank-- Rutgers Univ.
Earl Young-- Woods Hole Oceanographic Institution
Susan Hanneman-- Contractor to NOAA, Portland, Oregon(The project was jointly funded by the National Science Foundation and NOAA)
