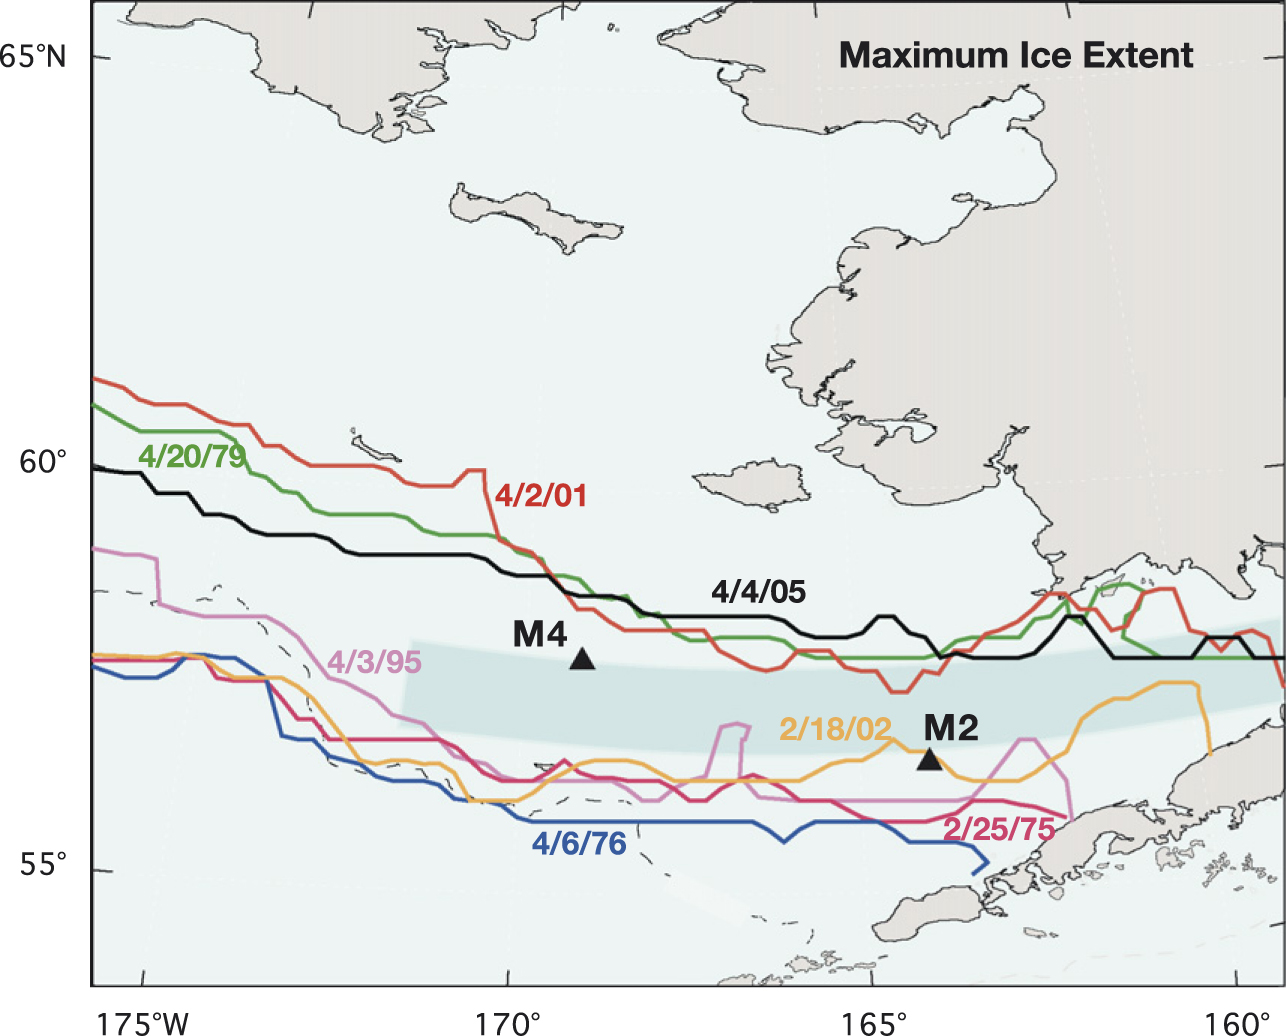
Sea ice is a crucial aspect of the physical environment of the Bering Sea. Most of the sea ice forms in polynyas in the northern Bering Sea. Beginning roughly in November, episodic outbreaks of Arctic winds cool the water column, form ice, and advect the ice southward. The leading edge of the ice melts as it is advected over warmer water, rapidly cooling the water column. Maximum ice extent has occurred as early as January and as late as May (Fig. 2). Although at maximum extent, sea ice typically covers much of the eastern Bering Sea shelf, there is significant variability in its extent, concentration and duration. Shown in Fig. 2 are the maximum ice extents for 3 years with minimal ice cover (1979, 2001, and 2005) and for 4 years with more extensive ice cover (1975, 1976, 1995, and 2002). As can be seen, maximum ice extent can vary by ~300 km (e.g., 1976 versus 2001).
Fig. 2. Maximum ice extent (45% concentration) during selected years as discussed in the paper. The locations of M2 and M4 are indicated as triangles. The shaded area is the box where ice concentrations shown in Fig. 3 were calculated.
There are numerous ways of showing the variability in ice extent, each of which reveals different aspects of the spatial and temporal patterns that characterize ice coverage. First, we focus on the average concentration of ice in a 1°-latitude "box" from 57°N to 58°N, and 171°W to the Alaskan coast (shaded area in Fig. 2). M2 is just south of the 57–58°N band and M4 is at its northern edge. The concentration in this band is an index of amount of sea ice present over the southeastern shelf. It is evident that during the pre-1977 "cold regime" (Stabeno et al., 2001), ice was extensive, covering more than 80% of the index area at maximum extent (Fig. 3). This 5-year period in the early 1970s was anomalously cold, with more extensive ice than in the 1950s and 1960s, although data records from this earlier period are limited. In addition, ice in the early 1970s persisted for months over the southeastern Bering Sea shelf. For instance, in the early 1970s ice was present in concentrations above 70% for 4–5 months. During the last three decades, there has been a marked decrease in ice extent, duration and concentration over the southeastern Bering Sea, with 2001 often characterized as having the smallest ice extent ever recorded over the shelf. The 5 years (2001–2005) since 2000 also have been characterized by low concentrations of ice. Specifically, there has been no period where ice concentration in the index box exceeded 70%, and the duration of significant amounts of ice (concentrations >25%) in the box has been at most a couple of weeks.
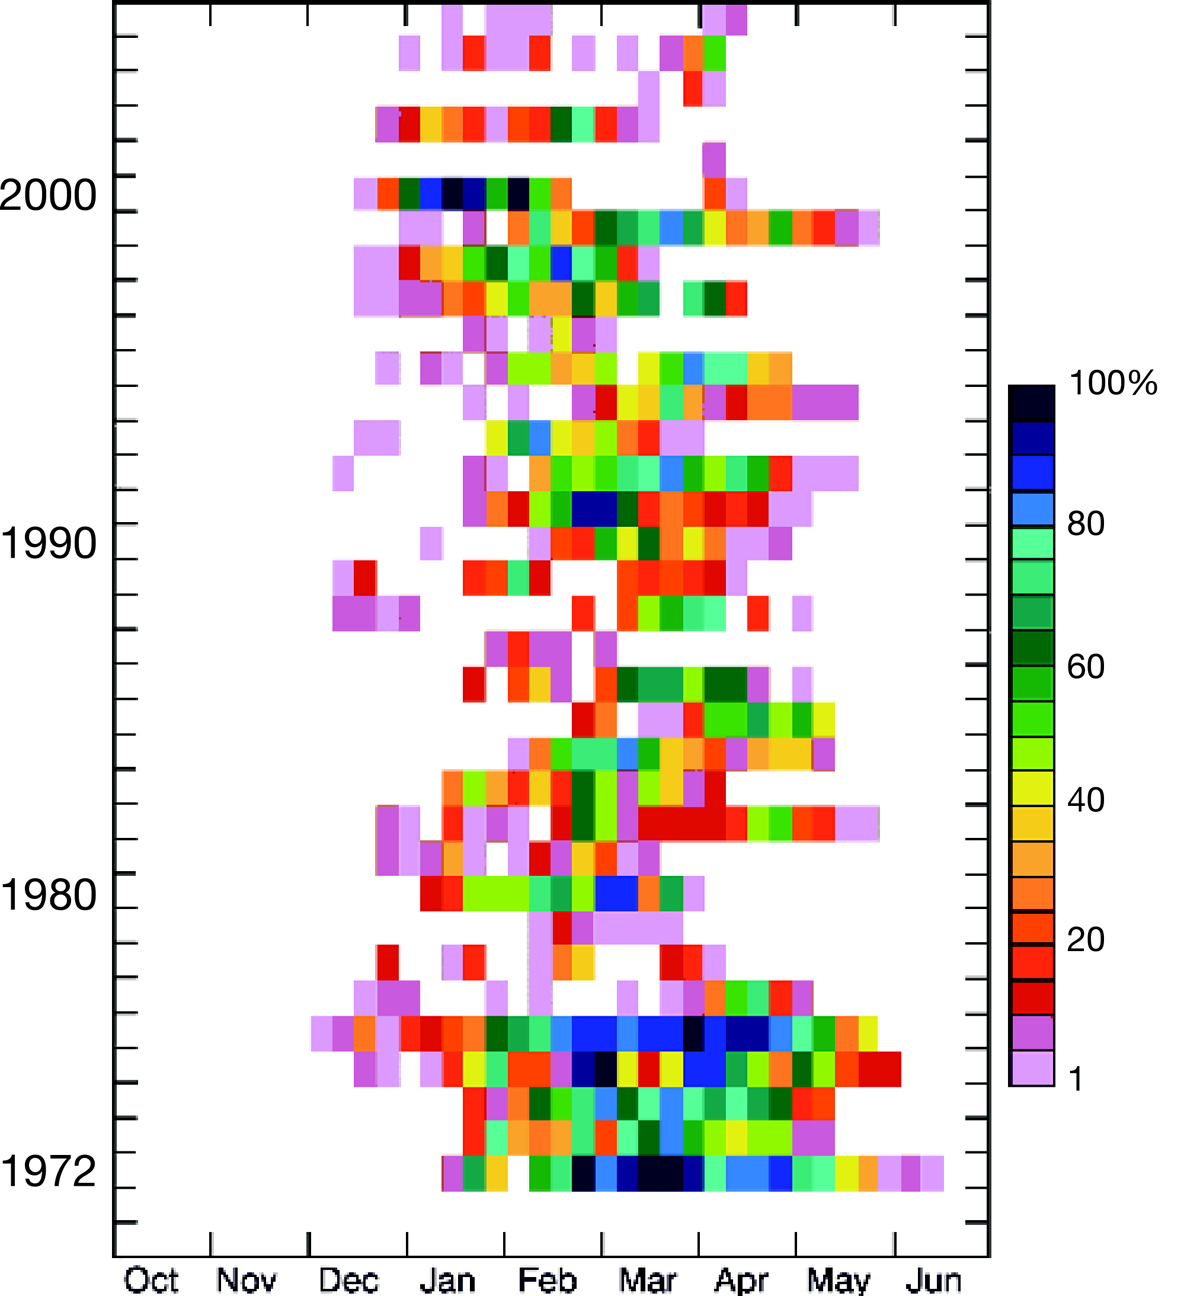
Fig. 3. Percent ice cover from 57°N to 58°N (the shaded area in Fig. 2). Each square represents 1 week.
Not only has the ice concentration changed, but the character of the ice advance has also changed during the last 6 years compared with the period 1989–1999 (referred to as the "cool period" in Stabeno and Hunt, 2002). In the "cool period," ice advanced steadily with little variability from year to year (Fig. 4A). During the last 6 years, the year-to-year variability in ice advance has been marked (Fig. 4B), and in 4 (2001, 2003, 2004, and 2005) out of 6 of the years, ice arrived much later than in the cool period of the 1990s. The ice retreat in the southern part of the shelf (south of 59°N) mostly occurred earlier than during 1989–1999. However, the retreat of ice over the northern shelf has been highly variable, with ice persisting longer in 2001 than was common in 1989–1999.
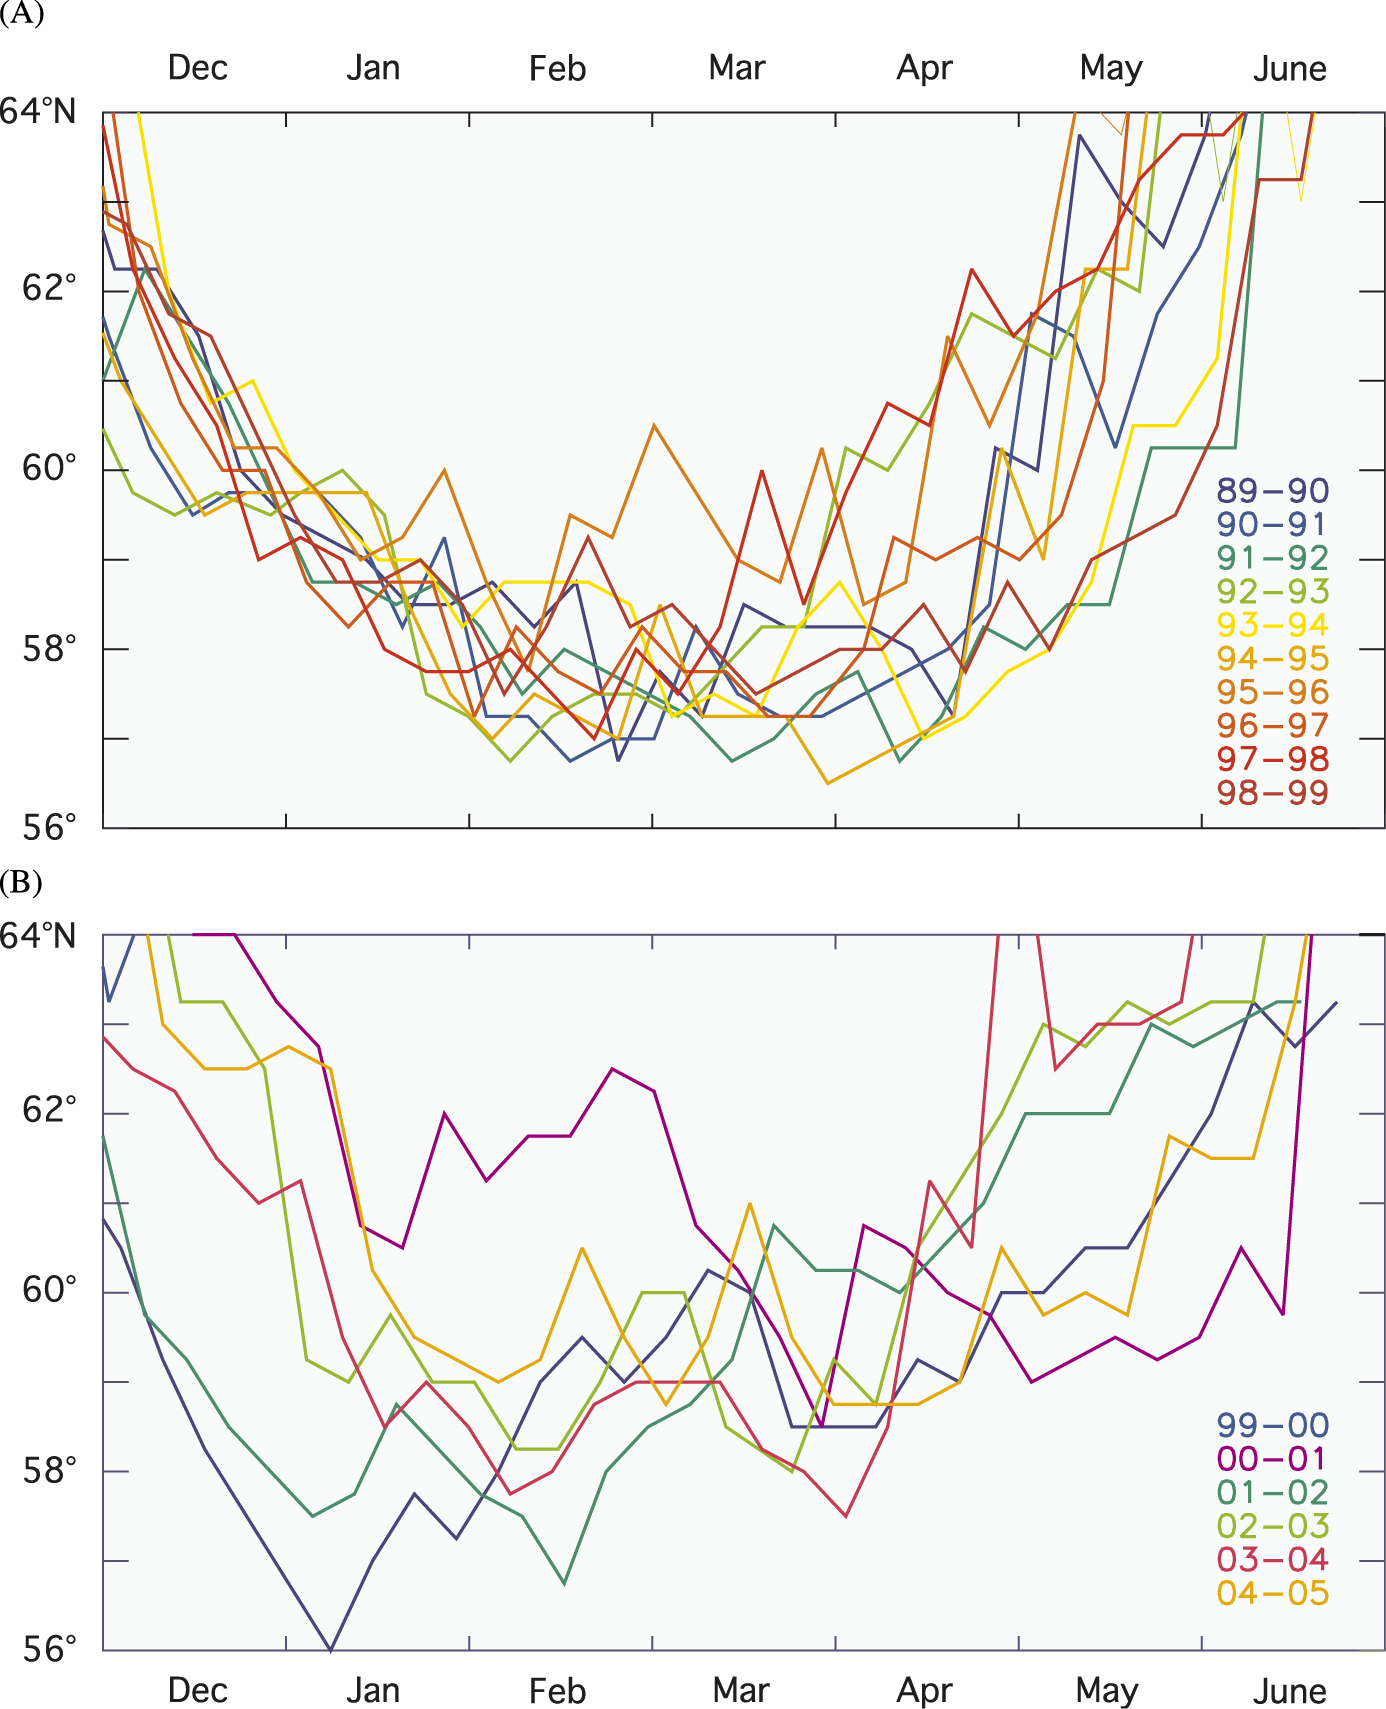
Fig. 4. The southernmost latitude of sea ice along 169°W during each week from December to June. The upper panel represents the ‘‘cool period’’ years from 1989 to 1999 and the bottom panel the warmer period that has dominated the system during the last 5–6 years.
The decadal shifts in sea-ice concentration coincide with changes in large-scale decadal patterns such as the PDO and AO. The PDO is the first mode of decadal variability in the North Pacific sea-surface temperature (SST). Phase shifts, often called regime shifts, occurred in 1947 and 1976 with a shift of the PDO time series from positive to negative, and negative to positive, respectively (see Fig. 5 in Bond et al., 2003). In 1989, the decadal variability of the North Pacific appeared to undergo a mode shift, with the second mode of SST variability (the Victoria Pattern) becoming more prominent and the first mode (the PDO) becoming less so. This resulted in the Victoria Pattern accounting for more variance than the PDO during the last decade and a half (McKinnell, 2004). In conjunction with shifts in the PDO in 1947 and 1976 and the strengthening of the polar gyre (AO) in 1976, there was a marked shift in the magnitude of some fish populations (Hare and Mantua, 2000). It is important to note that the PDO is an indicator of variability of the North Pacific and not the forcing mechanism of regime shifts. It is largely changes in the atmosphere that force changes in the SST. The mechanisms that cause these shifts in the atmosphere are not completely understood, nor is the role that the ocean plays in these atmospheric shifts.
In addition to decadal variability, sea-ice concentration and extent also vary on year-to-year time scales. For instance, changes in ENSO are weakly correlated with ice extent (Niebauer, 1988), with a tendency for an El Niño to be accompanied by less extensive ice in the Bering Sea (Stabeno et al., 1998). As shown by Rodionov et al. (2007), these correlations are weak because interannual variations in the wintertime conditions on the Bering Sea shelf are most closely related to regional anomalies in the atmospheric circulation.
A decrease in sea ice directly impacts watercolumn temperature and salinity. As the leading edge melts, it quickly cools the water column to the freezing point (approximately –1.7°C) and freshens it. Depending upon when and how the ice retreats, it leaves behind different water-column signatures. If the ice melts or is advected away slowly, and there are no strong storms after its retreat, the surface layer will be fresher than the near-bottom water. As the water warms during the spring, the salinity gradient contributes to the strength of the density difference between the top and bottom layers, thus damping mixing over the middle shelf during summer. What usually occurs over the southeastern shelf, however, is that winds transport the ice northward off the southern shelf, and the combination of winds and surface heat fluxes is sufficient to maintain a quasi-isothermal water column prior to seasonal warming. With or without stratification due to salinity, spring and summer atmospheric heating results in a warm, surface-mixed layer. The strong density gradient then insulates the cold bottom layer from heating throughout the summer. This bottom layer is referred to as the cold pool (if temperatures are less than 2°C) or the cool pool (if bottom temperatures are greater than 2°C).
Ocean temperatures have profound influences on the distribution of many species of fish. For instance, walleye pollock (Theragra chalcogramma) tend to avoid water below 2°C (e.g., Wyllie-Echeverria, 1995; Overland and Stabeno, 2004). Species such as Arctic cod (Boreogadus saida) that prefer cold temperatures have retreated to the northern portion of the Bering Sea.
The sea ice over the shelf also determines the timing and nature of the spring phytoplankton bloom (Stabeno et al., 1998, 2001; Hunt et al., 2002). When ice is present after mid-March there tends to be a spring phytoplankton bloom in the marginal ice zone. In contrast, when sea ice is absent or retreats before mid-March, the spring phytoplankton bloom does not occur until after set-up of thermal stratification (Stabeno and Hunt, 2002).
Return to Previous section
Go to Next section