Presently, both M2 and M4 are recovered and redeployed in April/May and again in September/October. When shiptime is available and ice cover permits, the mooring sites also are visited during the winter, and the moorings are recovered and redeployed then. Biophysical data, collected by instruments on the moorings, include temperature, salinity, nutrients (since 2002 at M2, and since 2003 at M4), fluorescence and currents. Each year since 1995, an upward-looking, bottom-mounted acoustic Doppler current profiler has been deployed next to the main mooring at M2, and since 2004 at M4. Before 2004 current meters (RCM-7 or RCM-9) were deployed at M4 at 2–3 depths on the main mooring. During summer, the mooring at M2 includes a surface toroid and a full suite of meteorological variables is measured in addition to oceanographic ones.
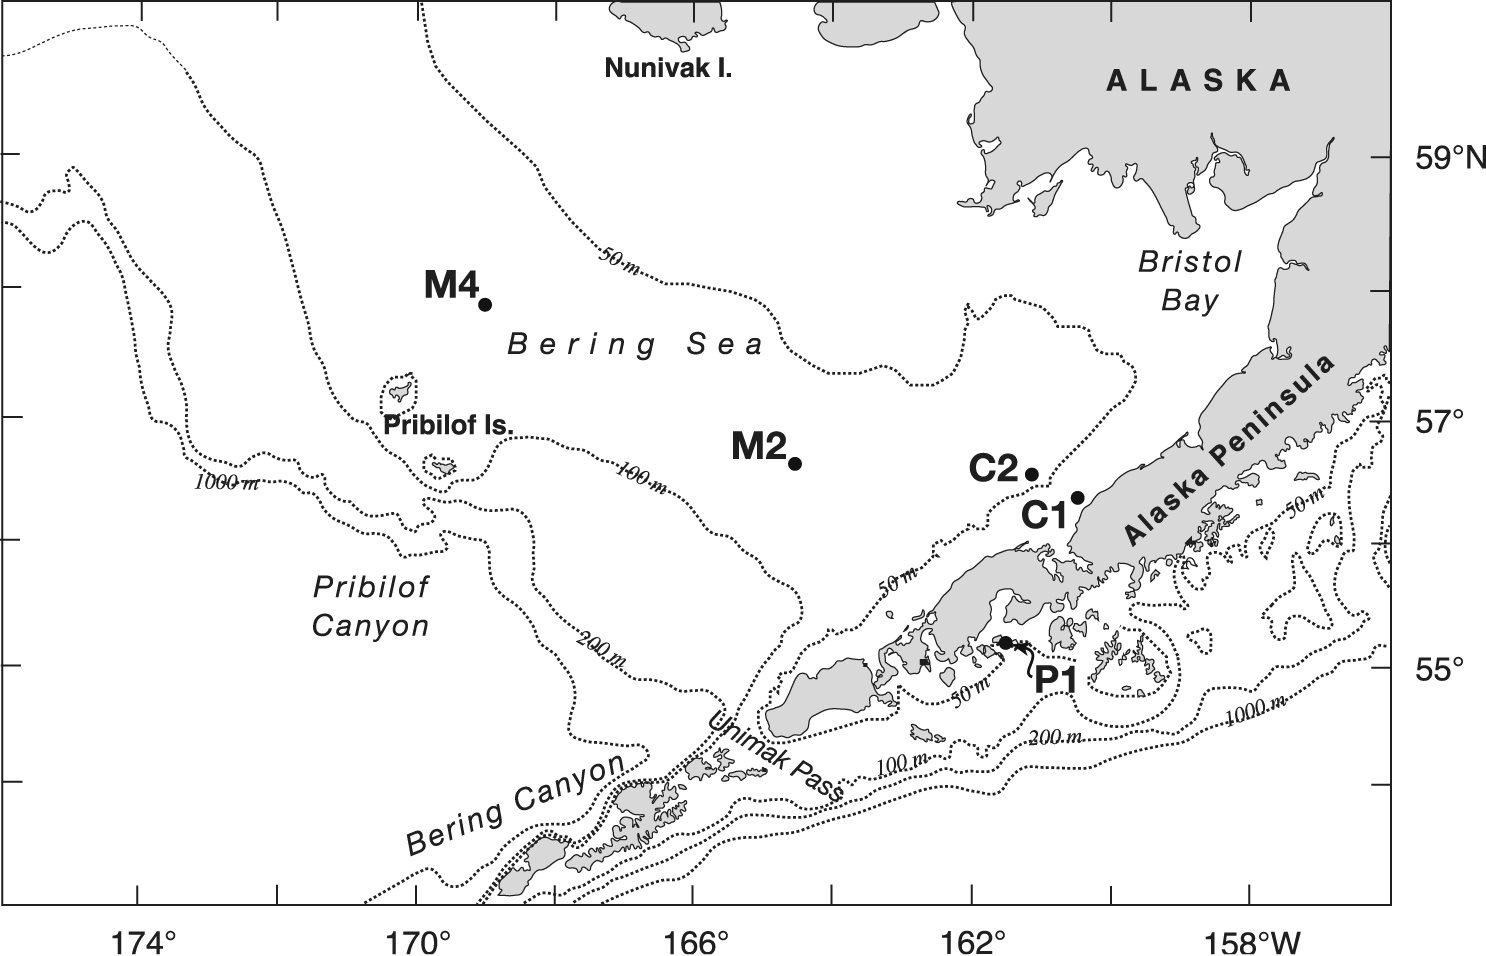
In addition to the major mooring sites of M2 and M4, simpler moorings have been deployed near the Alaska Peninsula with a goal to better understand bottom temperature and its impact on crab populations. Two moorings (C1 and C2, Fig. 1) measured temperature only near the bottom. In addition, a mooring site has been maintained for 10 years in Pavlof Bay (P1) on the south side of the Alaska Peninsula at which temperature is measured at three of these depths (20, 60, and 100 m). Moorings at all three sites are recovered and redeployed once per year, usually in April or May.
Fig. 1. Location map of the southeastern Bering Sea shelf showing the 50, 100, 200, and 1000 m isobaths. The locations of the five mooring sites discussed in the manuscript are shown.
Because of the presence of sea ice and the heavy fishing pressure in the region, the main mooring at each site is constructed of chain. The main mooring at M2 was moved by ice in 1995 and again in 1999, and was caught by fishing nets in 2000 and 2004. In both 1995 and 2000, the mooring was dragged ~10 km. The other two incidents shifted the mooring by <1 km. In 1995, all equipment on the surface toroid was lost, while in the winter of 2000, the upper 20 m of the subsurface winter mooring were lost. In the other years, the mooring was recovered intact. In 1998, the release failed at M2, resulting in the mooring drifting away. It took approximately a month to deploy a replacement at M2. In contrast, M4 has been recovered intact each year.
The number and locations of instruments at M2 have evolved with time (Table 1). There are more instruments on the mooring during the summer than during the winter, when the water column is usually well mixed and there is less biological activity. The upper instrument on the subsurface moorings (both deployments at M4 and the winter deployment at M2) is at 10–11 m. While this does not present a problem of undersampling in the winter, it can present a problem in the summer at M4, since the wind-mixed layer can be less than 11 m deep for at least short periods of time. This is discussed in more detail in the section entitled Observations from M2 and M4: Temperature. The placement of instruments was designed to observe the evolution of the wind-mixed layer, which is typically 20–25 m deep. There are fewer instruments in the lower part of the water column, since tidal currents result in a well-mixed bottom layer.
Table 1.
Instruments sampled nominally at 10-min to hourly intervals, but over the years M2 has been the site of several process studies in which the sampling was as rapid as every 2 min. Many of the data presented in this manuscript have been low-pass filtered with a 35-h, cosine-squared, tapered Lanczos filter to remove tidal and higher frequencies, and then resampled at 6-h intervals.
Conductivity–temperature–depth (CTD) data were obtained on virtually all recoveries and deployments and used for quality control of the data collected by instruments on the moorings. CTD measurements usually were taken with a Seabird SBE9plus system with dual temperature and salinity sensors. Data were recorded during the downcast, with a descent rate of 15 m min–1 to a depth of 35 m, and at 30 m min–1 below that. In addition, nutrient and zooplankton data were collected on each cruise in the vicinity of the moorings; these data are not presented in this manuscript.
Weekly data on ice extent and concentration were obtained from the National Ice Center (NIC). The NIC has published a CD of ice extent and concentration from 1972 to 1994. The CD specified ice concentration and extent in 0.25° latitude × 0.25° longitude bins. After a break of several years, the NIC began to place ice concentration information in GIS format on their website (http://www.natice.noaa.gov/pub/Archive/arctic/ and http://www.natice.noaa.gov/products/archi/index.htm), and we have now obtained data from 1995 to 2005 from that site and converted it to 0.25° bins. The NIC uses satellite data from Radarsat, DMSP, and Envisat as well as aerial reconnaissance, local information, climatology, and meteorological information, and models to produce their estimates of ice extent and concentration.
Analysis of air–sea interactions over the Bering Sea shelf is based on the synthetic data from the NCEP/NCAR reanalysis (Kalnay et al., 1996). We follow the procedure used in Bond and Adams (2002) to specify particular elements of the atmospheric forcing of the Bering Sea shelf on a daily basis for selected periods. The winds from the reanalysis are quite reliable in this region (Ladd and Bond, 2002). We also consider air–sea heat fluxes, and while they are expected to be less accurate than the reanalysis of winds, the signals in the Bering Sea are large enough to be meaningful.
Return to Previous section
Go to Next section