A decade of observations at M2 have expanded our understanding of the Bering Sea ecosystem, in particular the physical and chemical (bottom-up) mechanisms that control primary production. In Fig. 5A and B, temperatures were extrapolated from the upper thermistor to the surface if that thermistor was at or above 11 m. At M2 during the spring/summer months (April–September), temperature was measured at ~1 m. During most years, the surface mooring, with a thermistor at 1 m, was deployed in April and recovered in September or early October. The average difference between temperatures measured at 1 m (T1) and those measured at 11 m (T11) was less than 0.03°C in April, September and October. During November through March, the wind mixed layer is greater than 10 m, so the thermistor at 11 m is a good estimate of surface temperature. Noting this, a similar conclusion can be made for M4: from September through April, temperature measured at 11 m is a good estimate of surface temperature. For M4 during summer, the best estimate of how surface temperatures compare to those at 11 m comes from an examination of temperature differences at M2. At M2, the average temperature difference (T1–T11) during August (1995–2005) was 0.13°C and during May was 0.27°C. The differences in June and July were larger, 0.69 and 0.44°C, respectively. These larger differences are largely caused by particularly weak winds during specific years. For instance, June 1997 was particularly calm, and 20 of 40 days where T1–T11 exceeded 2°C were in that month. Similarly, 9 of the 40 days where T1–T11 exceeded 2°C were in July 2004. Most of the other times when T1–T11 > 2°C were single calm days. So for June and July, using temperatures at 11 m as an indication of surface temperatures at M4 can be an underestimation.
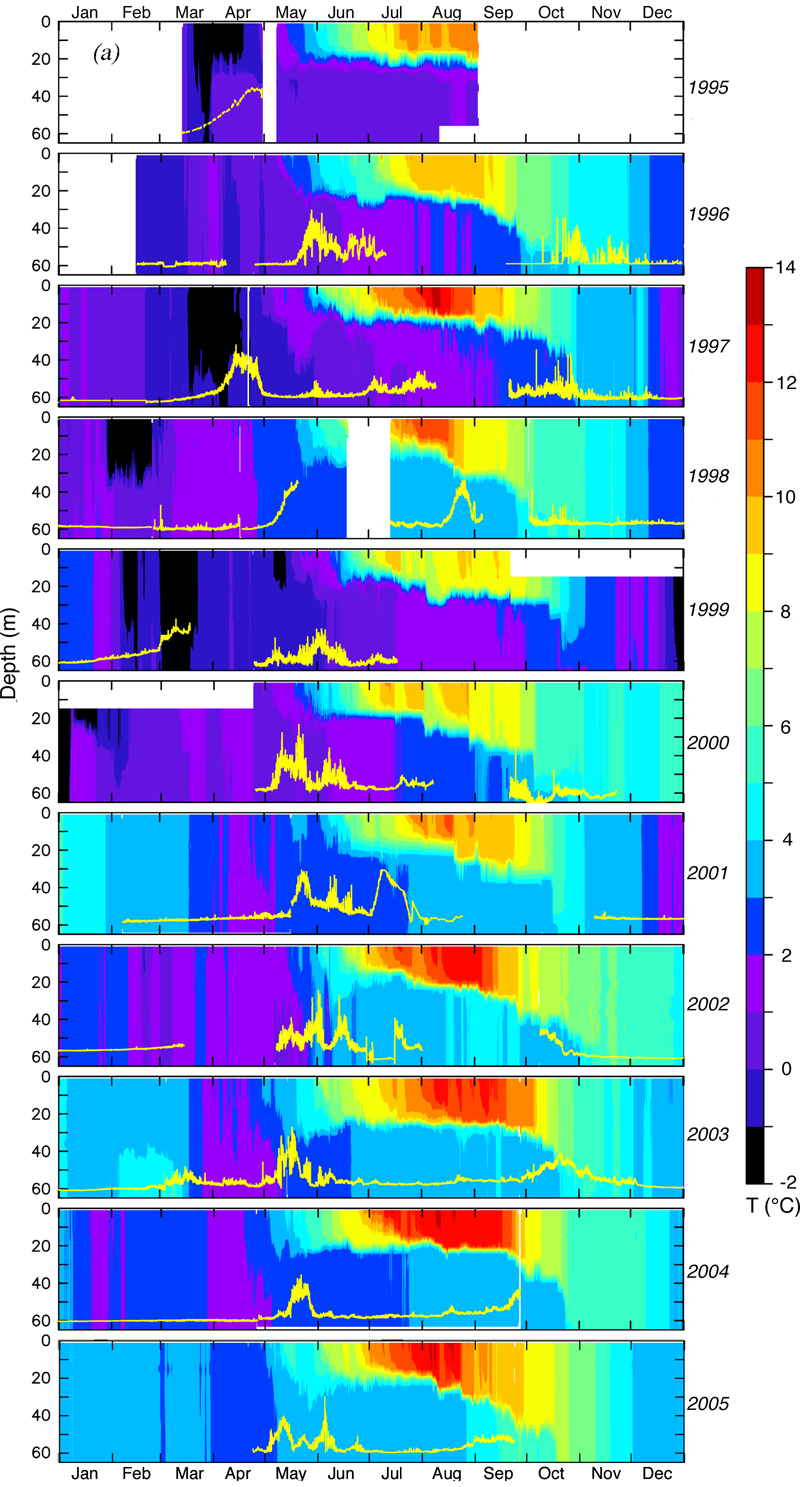
Fig. 5. (A) Contours of temperature measured at M2. The coldest temperatures (black) occurred when ice was over the mooring. The temperature contours have been extended to the surface from 10m during winter (October–March) period as discussed in the text. The yellow line is fluorescence measured at ~11 m. Note that early blooms are associated with the presence of ice. (B) Contours of temperature measured at M4. The coldest temperatures (black) occurred when ice was over the mooring. The temperature contours have been extended to the surface from ~10 m as discussed in the text. The yellow line is fluorescence measured at ~11 m. Note that early blooms are associated with the presence of ice.
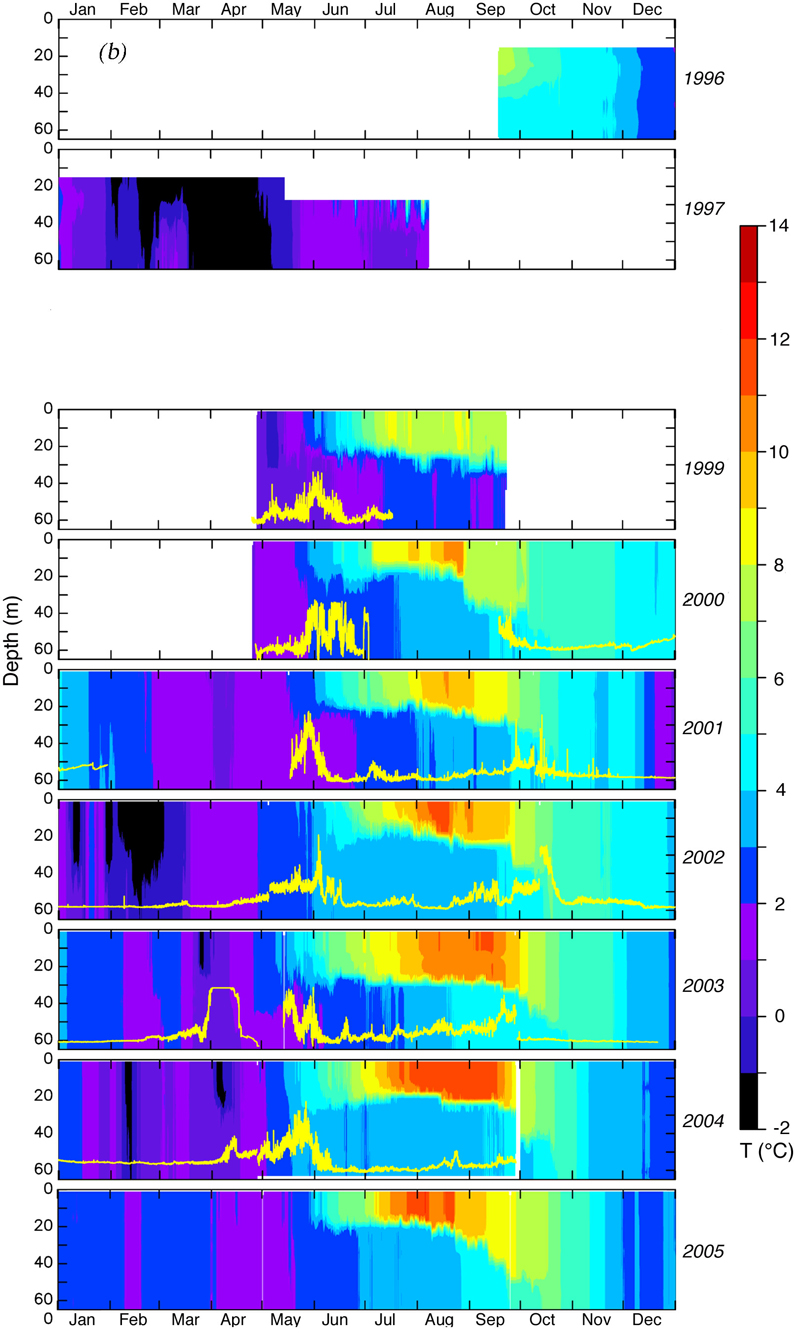
Fig. 5. (Continued)
The temperature records (Fig. 5) from the moorings at M2 and M4 reveal a well-defined seasonal cycle that is typical for the southeastern middle shelf. In January, the water column is well mixed. This condition persists until buoyancy is introduced to the water column either through ice melt or springtime (predominantly solar) heating. The very cold temperatures (<–1°C; indicated by black in Fig. 5) that occurred in 1995, 1997, and 1998 at M2, and in 1997 and 2002 (to a lesser extent in 2003 and 2004) at M4, resulted from the local melting of ice. Generally, once stratification develops during April, the water column exhibits a well-defined two-layer structure that is characteristic of the middle shelf (water depths 50–100 m) throughout the summer, typically consisting of a 15–35 m wind-mixed layer and a 35–45 m tidally-mixed bottom layer. This bottom layer is the cold or cool pool. In earlier years (1995, 1996, 1997, and 1999) the bottom temperatures were below 2°C, but in more recent years bottom temperatures have been much warmer, indicating no formation of the southern cold pool. Deepening of the mixed layer by strong winds begins as early as mid-August, and by early November the water column is again well mixed.
At M2, the coldest summer SSTs occurred in 1999 (Fig. 5), which had a late ice retreat (Fig. 3). The warmest summer SST occurred in 2004, when temperature in the wind-mixed layer exceeded 12°C for over 2 months. Bottom temperatures were coldest in years when ice was present during the spring. Typically, the temperature of the wind-mixed layer increased by ~10°C during the late spring and summer, while bottom temperatures, insulated by the sharp density gradient, warmed by only a few degrees during the same period.
The depth-averaged temperature was calculated using temperature time series measured at M2 and M4 (Fig. 6). The errors in these estimates at M2 are small, but during the summer at M4 the underestimation of average temperature is larger. For instance in June when the monthly average T1–T11 is 0.69°C, the depth-averaged temperature at M4 would be underestimated by ~0.1°C and in particular months it could even be larger. For instance, in July 2004 the monthly average temperature was underestimated by ~0.3°C.
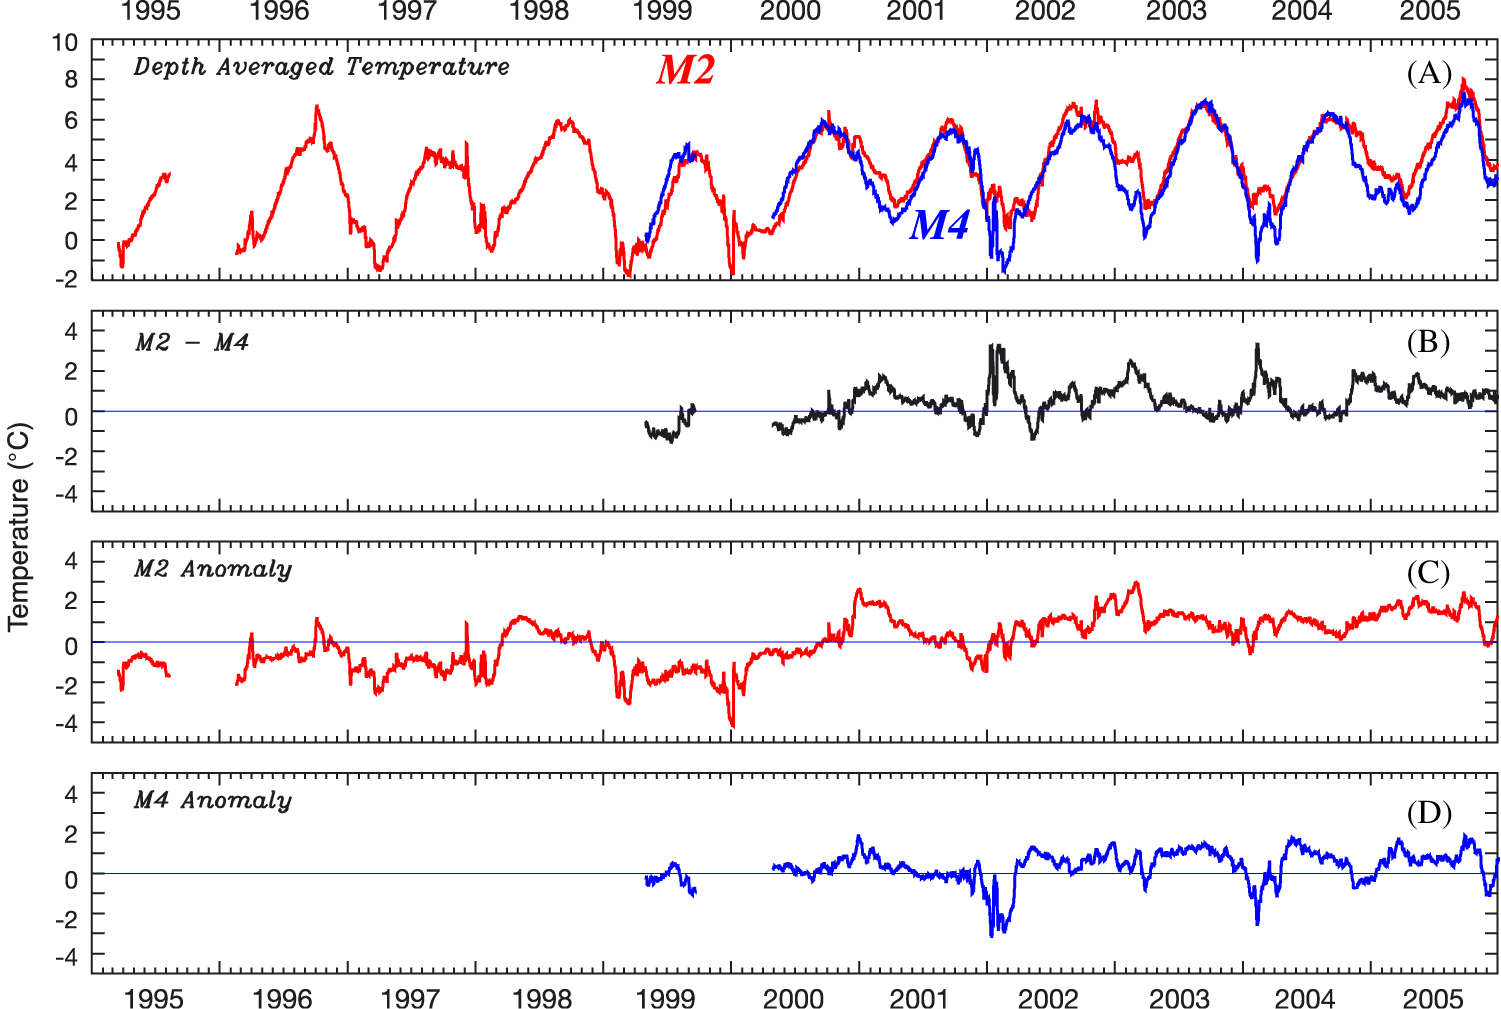
Fig. 6. (A) Depth-averaged temperature at M2 and M4. (B) The difference between depth-averaged temperatures at M2 and M4. The depth-averaged temperature anomaly (the seasonal signal has been removed) at (C) M2 and (D) M4. All time series have been low-passed filtered.
As expected, a strong annual signal is clearly evident in the time series, as is the marked warming at M2 that occurred in 2000. Recall that the location of M2 was chosen because historically ice occurred over this site for a few weeks virtually every winter. This pattern of ice being advected over the M2 site and cooling the water column continued from 1995 to 2000, but from 2001 to 2005 no ice (that is, ice areal concentration was less than 10%) covered the M2 site, although in 2002 the edge of the ice was very close to the mooring. This lack of sea ice has contributed to the sharp warming of ~3°C in the winter and ~2°C in the summer at M2.
Unfortunately, the record at M4 is too short to identify clearly a shift in temperature, although the limited data collected there in 1997 (Fig. 5B) show much colder winter conditions than observed after 2000. The ice extent in 1997 was fairly typical of the 1980s and 1990s (Fig. 3), which suggests that temperatures at M4 also would have undergone a warming in 2000 with the reduction in ice extent. M4 is farther north than M2, and therefore is exposed to more extensive ice cover and colder ocean temperatures, at least during the winter, than occurs at M2. Colder temperatures were clearly evident in 2002, when ice covered M4 sporadically for 2–3 months, but did not reach M2. Interestingly, during the spring and summer, ocean temperatures are not always warmer at M2 than M4 (e.g., late spring and early summer 1999 and 2000 in Fig. 6).
It has been observed previously that during years of extensive ice cover, the southern cold pool (centered on M2) can be separate from the northern cold pool (north of 59°) (Schumacher and Stabeno, 1998). The water column near M4, which lies in the broad boundary between the southern and northern cold pools, appears to be modified by a weak, local cross-shelf flow. This flow is likely an extension of the flow around the Pribilof Islands. Significant anti-cyclonic flow occurs around the Pribilof Island (Stabeno et al., 2002a; Kowalik and Stabeno, 1999), and some of this flow continues eastward across the shelf at ~57.5°N (Schumacher and Stabeno, 1998; Stabeno et al., 2001). Thus M4 may be warmed by weak flow that originates along the slope of the Bering Sea. However, from an examination of the currents in Section 3.2.2 below, this is not clear.
The trend of warming over the shelf is clearly evident when the annual cycle has been removed (Fig. 6C and D). At M2, from 1995 to 1997, depth averaged temperatures were 1–2°C cooler than the mean, except for a month-long warming that occurred in September 1996 as a result of advection. Depth-averaged temperature was above average in 1998, and then cooled again in 1999 and 2000. Since then conditions have largely been warmer than the 10-year seasonal cycle. The warm anomalies have been slightly greater in winter (~3°C) than in summer (~2°C). Using an annual signal from just 1999 to 2005 at M4, the temperature anomalies there also show some indication of warming during the summers, although winter conditions are highly variable and clearly dependent upon the presence (or absence) of sea ice.
Farther to the southeast near the Alaska Peninsula, the near-bottom temperatures at C1 and C2 also show a strong seasonal signal (Fig. 7). The water column at C1 (water depth ~20 m) is well mixed because of strong tidal currents. C2 (water depth ~60 m) is well mixed during the winter, but has a two-layered structure during the summer. The water column at C1 responds quickly to atmospheric forcing, resulting in warmer temperatures during the summer and cooler temperatures during the winter than at C2. These moorings were first deployed just 1 year later than the first deployment at M2. Temperatures at C1 and C2 show a pattern similar to that at M2 with warmer winter conditions dominating since 2000. Thus, it is likely that the conditions observed at M2 andM4 are representative of much of the middle shelf south of St. Matthew Island.
![]()
Fig. 7. Near bottom temperatures at the two moorings in Bristol Bay. C1 is in 20 m of water and C2 in 60 m. The time series have been low-pass filtered.
The moorings in Pavlof Bay (P1; Fig. 1) in the Gulf of Alaska show a very similar pattern to that observed in the southeastern Bering Sea (Fig. 8). As in the Bering Sea, the winter temperatures of 1999 and 2000 were colder than temperatures from 2001 to 2005, with the summer of 2004 particularly warm. This site is interesting, even though it is not in the Bering Sea, in that the temperature was modified by large scale climate patterns that affected both the Bering Sea and the Gulf of Alaska, and perhaps by local atmospheric forcing. The water at Pavlof Bay and along the south coast of the Alaska Peninsula eventually passes through Unimak Pass and into the Bering Sea (Stabeno et al., 2002b).
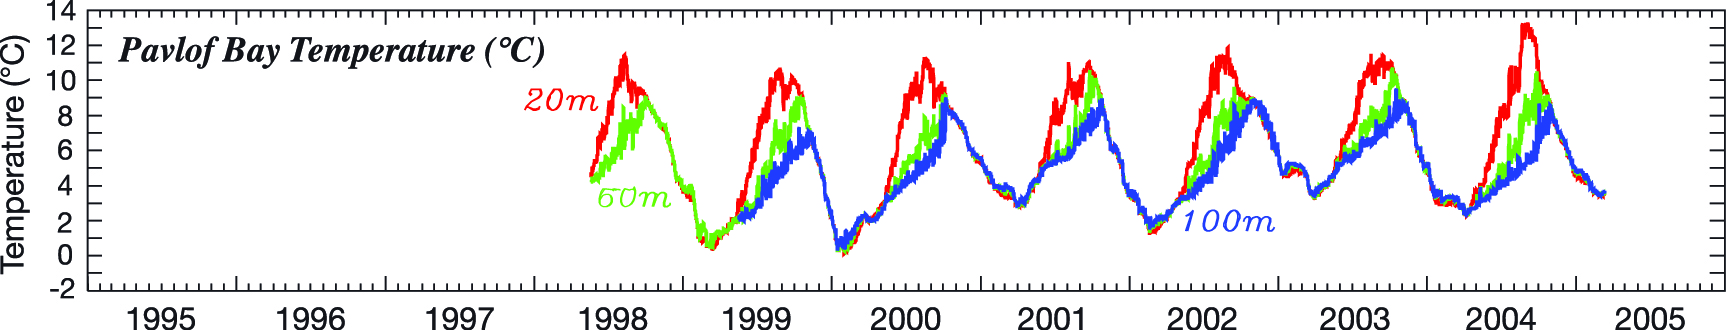
Fig. 8. Temperature at three depths (20, 60, and 100 m) at the entrance to Pavlof Bay in the Gulf of Alaska (P1 in Fig. 1). The time series have been low-pass filtered.
The measurements at M2 and M4 also include currents. The low-pass filtered currents from 2001 to 2002 are characteristic of the variability in currents at M2. While currents are weak in summer (Stabeno et al., 2002a), during fall they become more energetic (Fig. 9) not only at the surface, but also near the bottom of the water column. These stronger currents persist into the winter. Although the low-pass filtered currents can be fairly energetic, exceeding 10 cm s–1 for several days, the monthly mean flow tends to be sluggish (Fig. 10A).
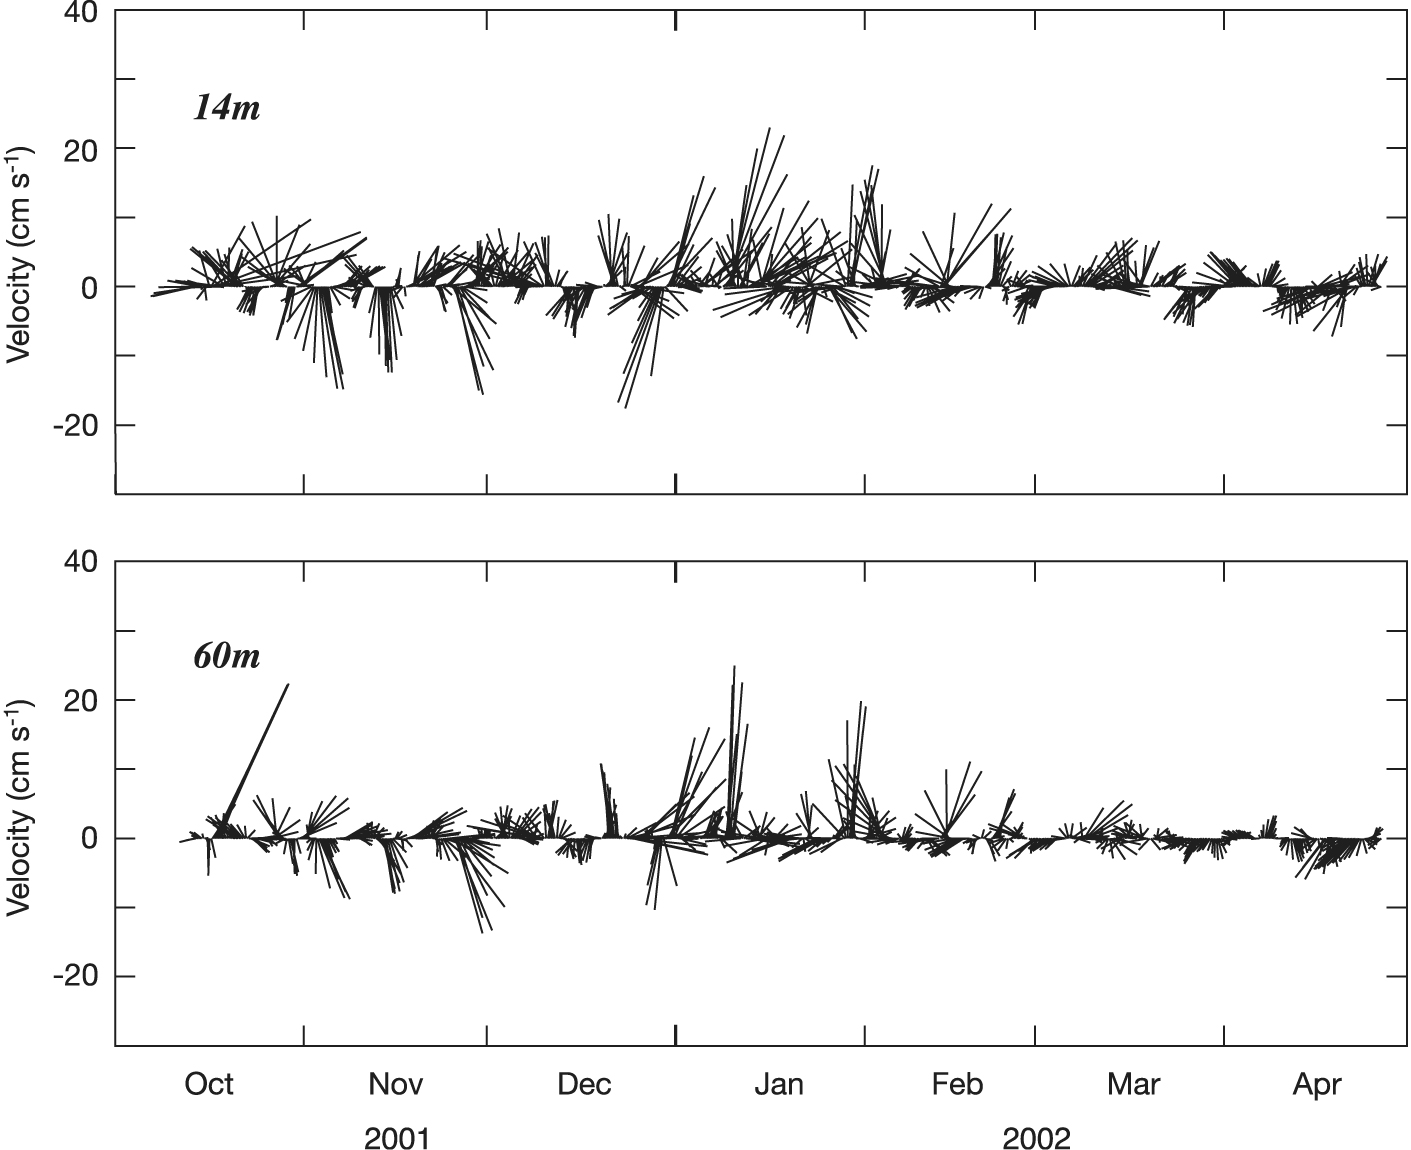
Fig. 9. Low-pass filtered current velocity measured at 14 and 60 m depth at M2. Up is northward flow.
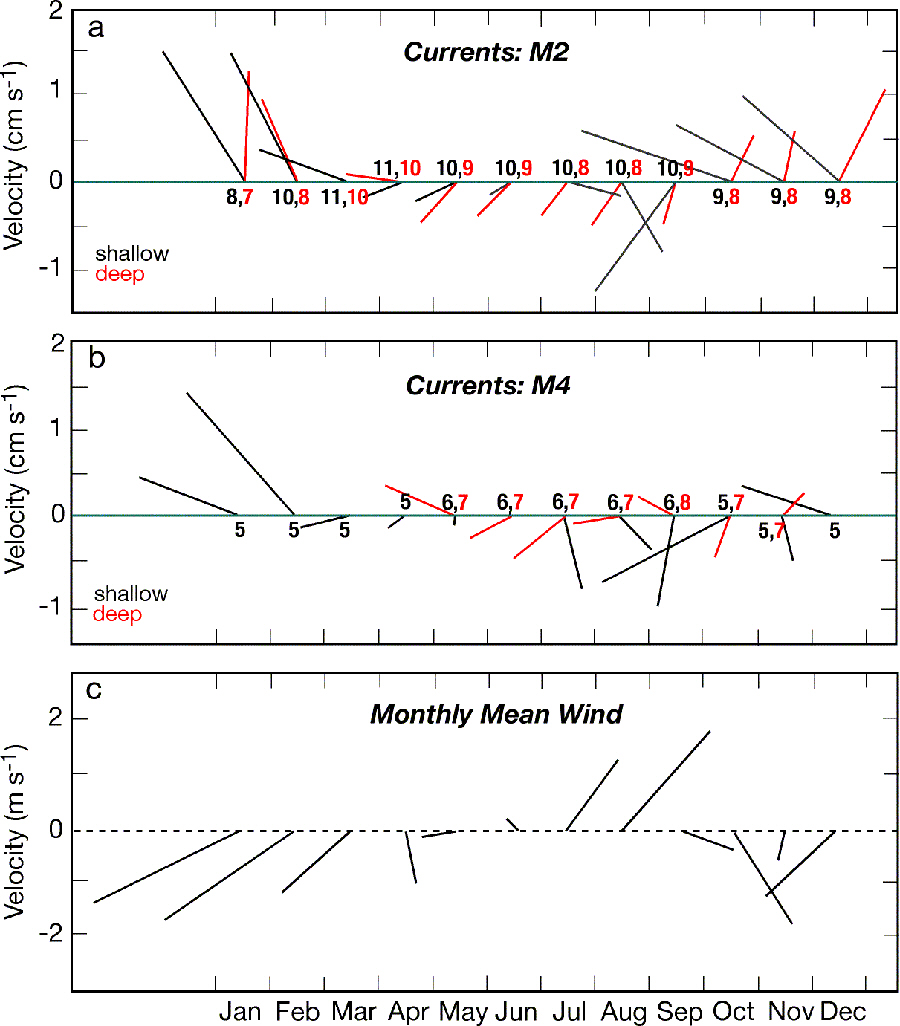
Fig. 10. The mean monthly current velocity (A) at M2 and (B) at M4. The shallow currents were measured at depths of 8–12 m and the deep currents were measured at 55–65 m. The numbers along the axis indicate the number of years that there were data during that month. (C) The NCEP reanalysis wind velocity has been interpolated to the position of M2. Up is northward flow.
The length of the record at M2 is now sufficient to resolve the mean seasonal cycle in currents at that site. From October to March, monthly mean currents in the upper water column are >1.5 cm s–1 (except in March), and have a northward component (Fig. 10A). The flow near the bottom is weaker, but also has a northward component during the winter. During the remaining 6 months, the monthly mean flow is weaker with a southward component. The time series at M4 is shorter than that at M2, but they show a similar pattern (Fig. 10B). The strongest flows are in January and February, with a northward component during November through February. During the remainder of the year the flow has a weak southward component. It is interesting that there is no evidence of eastward flow in the monthly means at M4, as was observed in satellite-tracked drifter trajectories (by Reed and Stabeno, 1996). They hypothesized that such a flow could explain the warming that occurs at M4.
The mean monthly winds (from NCEP/NCAR Reanalysis) also feature a well-defined annual cycle: southwestward winds (~2 m s–1) from December to March weaken during spring and shift to northeastward in July and August (Fig. 10C). During months with stronger mean winds (January–March, August, November, and December), the currents in the upper water column are 80–120° to the right of the wind. While the near-surface currents at M2 may be influenced by Ekman dynamics at times, it is clear that other dynamics play a critical role in forcing the currents over the shelf. They are likely forced by more regional effects, presumably in combination with local baroclinicity.
The timing of spring primary production on the southern Bering Sea shelf is determined by a combination of the date of ice retreat, solar heating and wind mixing. If the ice retreat is late, i.e. after mid-March as occurred in 1995 and 1997, an early phytoplankton bloom occurs under the ice in cold water (Fig. 5). With an early ice retreat as occurred (1996 and 2000) or during winters that are ice-free (2001–2005), the bloom occurs later, in May or even June, when surface heating due to insolation provides the necessary ocean stratification.
Time series from M2 and M4 have documented this process. The fluorescence (depth ~11 m), shown in Fig. 5, is an indication of the timing of the phytoplankton blooms (enhanced fluorescence), not an indication of production rates. All the time series have been normalized so that the maximum peaks are of similar magnitude. At M2, the ice-associated bloom consumes all the nutrients in the upper water column (Stabeno et al., 2002a), preventing a later spring bloom, although episodes of higher fluorescence will occur during summer storms (e.g., August 1998) that entrain water from the nutrient-rich bottom layer. The fall is often characterized by an increase in fluorescence that corresponds to the break down of the strong two-layer structure that characterizes the middle shelf during summer.
It has long been hypothesized that an early spring phytoplankton bloom results in a mismatch between peak phytoplankton biomass and zooplankton grazing, and results in higher flux of carbon to the seafloor and a smaller copepod biomass compared to years with early ice retreat (Hunt et al., 2002). It also results in a mismatch between larval pollock and their prey (Napp et al., 2000). While there is evidence to support these hypotheses over the southern shelf (Hunt et al., 2002; Napp et al., 2000), there is less information over the northern shelf (north of St. Matthew Island).
Return to Previous section
Go to Next section