The following synthesis is derived from recent overviews of the physical environment of the Bering Sea, one focusing on the continental shelf (Schumacher and Stabeno, 1998) and the other on the oceanic regime (Stabeno et al., 1999). The eastern Bering Sea (Fig. 1) consists of a broad (>600 km), shallow shelf that extends ~1000 km from the Alaska Peninsula north to Bering Strait. This shelf is divided into three depth domains: coastal (0-50 m), middle (50-100 m) and outer (100-180 m). From April to September, each domain has distinctive hydrographic characteristics and circulation patterns. The coastal and middle domains are separated by a structure front (the inner front), and the middle and outer domains are separated by the less distinct middle transition zone. The vertical structure is well mixed in the coastal domain, two-layered over the middle shelf, and three-layered (with upper and lower mixed layers separated by a region containing fine structure) over the outer shelf. These structures are maintained by the wind, which mixes the upper water column, and by tidal currents, which mix the lower layer. In the coastal domain these mixing regimes overlap, resulting in a zone characterized by weak stratification. Over the middle and outer shelf, the upper mixed layer's temperature and depth vary from year to year, dependent upon the strength and timing of storms and the thermodynamic balance between heat content from the previous summer and ice extent during winter. The temperature of the lower layer is dependent upon the previous winter's cooling.
Hydrographic characteristics across the shelf
Between 1977 and 1998, hydrographic casts were conducted on numerous occasions along the transect (or some portion thereof) shown in Fig. 1. During June and July of these years, this transect was occupied 11 times. Statistics of various characteristics of the transects obtained from these observations (Table 1) provide information on the temporal and spatial variability of the physical structure over this shelf during the summer. Following the occurrence of the extensive ice cover during 1976 and its associated cold pool, a regime shift occurred that is reflected in the atmospheric indices. From 1977 to 1981, ice cover was minimal and the cold pool over the south-east Bering Sea shelf either did not exist or was extremely small. During these years, the coldest bottom temperatures were about 4°C. In later years, the cold pool once again was a dominant feature of the south-eastern middle shelf, reaching a maximum horizontal extent along the transect in 1997. These fluctuations in the existence and size of the cold pool closely follow the patterns in ice cover.
Table 1. Hydrographic characteristics of the physical oceanographic
features on a section across the south-east Bering Sea shelf. The dates on which
each section was made are shown at the top. The upper mixed layer is defined
to be the depth of constant temperature and salinity equal to that near the
surface (3-5 m). The top 3-5 m is excluded to eliminate the effects of daily
warming during stable periods. The midpoint depth of the thermocline is located
and the density difference across it is defined in units of 

 (103
kg m-3). The lower water column is defined with respect to temperature
of the cold pool (2°C, 3°C and 4°C), its central salinity (psu),
the width (km) of the zone and the latitude of its centre. The width of the
inner front is defined from the position where temperate contours begin to diverge
to the nearshore location where the water column becomes well mixed. The central
position of the middle transition zone is defined as the bottom mid-point of
the tight contours plunging from
(103
kg m-3). The lower water column is defined with respect to temperature
of the cold pool (2°C, 3°C and 4°C), its central salinity (psu),
the width (km) of the zone and the latitude of its centre. The width of the
inner front is defined from the position where temperate contours begin to diverge
to the nearshore location where the water column becomes well mixed. The central
position of the middle transition zone is defined as the bottom mid-point of
the tight contours plunging from  40 m to the bottom. Asterisk (*) indicates data not available;
None indicates cold pool not present.
40 m to the bottom. Asterisk (*) indicates data not available;
None indicates cold pool not present.
To illustrate the structure of the cold pool, the inner front and middle transition zone, we present observations from the transect occupied 26 July 1982 (Fig. 6a). This section was selected because the across-shelf structure on that day was closest to the mean conditions presented in Table 1. Moving seaward from the coastal domain where the water column is nearly isothermal (temperature difference from top to bottom is 0.1°C), the first feature encountered is the inner front. In this transect, the inner front forms a well-developed, sharp transition between middle shelf and coastal waters. The cold pool is well defined, with some horizontal variability in the temperature. At the seaward edge of the middle shelf, the isotherms become more tightly spaced horizontally, indicating the broad middle transition zone. Here, this increased horizontal temperature gradient extends from a depth of 40 m to the bottom and is centered at a bottom depth of 100 m. As generally occurs (Coachman, 1986), there is no surface manifestation of the middle transition zone.
Figure 6. Contours of temperature (near the transect shown in Fig. 1) from CTD casts collected during (a, upper) July 1982 and (b, lower) June 1997. Cast locations are indicated by arrows at bottom of each panel. Contour intervals are 0.5°C.
In contrast with the typical transect of 1982, the 1997 transect (Fig. 6b) shows marked differences including a shallower mixed layer, a stratified water column extending inshore to a depth of <35 m, the broadest inner front ever observed, and a cold pool with the greatest horizontal extent. It should be noted that the 1997 transect was taken 5-6 weeks earlier in the year than the 1982 data, and some of these comparisons may therefore be biased. The transect during June 1998 was much shorter and is not shown, but strong contrasts between 1997 and 1998 are evident. During 1998, the water column was characterized by weak stratification over the middle shelf, an inner front centered about 130 km farther seaward than observed in 1997, and warmer bottom water (>3.5°C).
In the middle domain, the temperature structure of the water column from May
to October can usually be characterized by a top, mixed layer of warmer, fresher
water overlying a layer of colder, sometimes saltier water (the cold pool).
The two layers are separated by a thermocline, the thickness of which ranges
from <1 m to 15 m. The summer depth of the surface layer depends on wind
mixing; the bottom is tidally mixed. The integrated effect of wind, ice melt
and solar insolation determines the density difference ( of 0.25-1.25
in July) between the top and bottom layers of the water column.
There were marked differences in the temperature-salinity characteristics among the sampled years at Site 2 (Fig. 7). The large range in temperature usually makes it the dominant factor in determining the density structure, but during some years (most notably 1976, 1984, 1986 and 1997) salinity made a comparable contribution to density. During these four years, ice was present for at least several weeks, and the fresh water from the melting ice and weak winds stabilized the water column. During years when strong winds occur while sea ice is present or after its retreat, the low-salinity water from ice melt is mixed, reducing or removing the vertical salinity gradient. Strong vertical gradients in salinity are often associated with years when ice persists well into spring. The coldest bottom temperature occurred in 1976, the year with the most extensive ice cover on record; temperatures remained near freezing until late May. A strong density interface between the upper and lower layer (due both to temperature and salinity) inhibited the warming of the bottom layer, and thus enhanced the persistence of the cold pool. This occurred again in 1995, when the bottom layer was modified by the horizontal advection of cold saline water. In contrast, the density difference between the upper and lower layers in 1997 and 1998 was not particularly strong and thus permitted significant heating of the bottom layer.
Figure 7. Temperature-salinity diagrams at Site 2 during (a, upper)
May and (b, lower) September/October. Lines of constant density are at intervals
of 0.25 . The
circles represent temperature and salinity at 5 m and the squares at 60 m.
Characteristics of middle shelf water temperature and salinity: Site 2
At two sites on the south-east Bering Sea shelf (Fig. 1), measurements of temperature, salinity, fluorescence and currents have been collected via moorings since 1995. From April through September, the ocean environment was monitored using surface moorings that also gathered meteorological data. During the rest of the year, because of the possible presence of sea ice, subsurface moorings were employed with the upper instruments at ~6 m below the surface. Details of the mooring design and instrumentation can be found in Stabeno et al. (1999).
The largest data set of oceanic variables has been collected at Site 2 in 70 m of water near the centre of the middle shelf (Fig. 1). From the examination of the transects along the hydrographic line discussed in the previous section, it is clear that this site is representative of a large portion of the south-eastern middle shelf. Temperature records from moorings (Fig. 8) reveal temporal variability on both seasonal and shorter time scales. In January, the water column is well mixed. This condition persists until buoyancy is introduced to the water column either through ice melt or solar heating. The very cold temperatures (shown in black in Fig. 8) that occurred in 1995, 1997 and 1998 resulted from the arrival and melting of sea ice. During 1996, ice was present for only a short time in February (when no mooring was in place). Generally, stratification develops during April. The water column exhibits a well-defined two-layer structure throughout the summer, consisting of a 15-25 m wind mixed layer and a 35-45 m tidally mixed bottom layer. Deepening of the mixed layer by strong winds and heat loss begins in August, and by early November the water column is again well mixed.
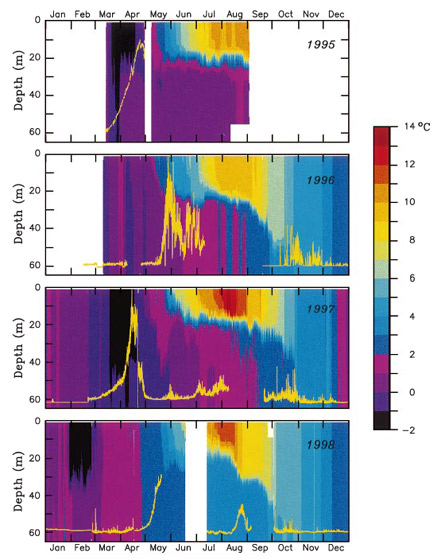
Figure 8. Temperatures measured at Site 2 (depth 70 m). Temperature was measured about every 3 m over the upper 30 m of the water column and then about every 5 m to the bottom. Each year there were three deployments of the instruments. Typically a subsurface mooring was deployed in September and recovered the following February. At this time two subsurface moorings are deployed. In April (after retreat of sea ice), a surface mooring is deployed and then recovered in September. The yellow line is fluorescence or chlorophyll at a depth of ~10 m. Each year the fluorescence is normalized to the maximum value of that year.
Using four years of mooring data, together with historical hydrographic data, we identified the timing and magnitude of the seasonal warming of the sea surface over the middle shelf (Fig. 9a). The upper layer begins to warm in early to mid-April, after the departure of any sea ice. Temperatures continue to increase to early August, when the maximum sea surface temperature typically occurs. During 1995-1998, the most rapid increase in near-surface temperature occurred in 1997 (~4.5°C month-1), while during the other three years warming was slower (~3.2°C month-1). In years before 1997, near-surface temperatures ranged from -1.7°C to 11.5°C, but temperatures well above this envelope were observed in the summer of 1997 and to a lesser extent in 1998. While the warmest near-surface temperature was observed in 1997, the water column as a whole was not particularly warm (Fig. 9b). The average water column temperature during 1997 was within the envelope of variability observed during the last 30 years. The warm surface temperatures that year were offset by a shallow mixed layer and cool bottom temperatures, so that the vertically averaged temperature was similar to that observed in 1995 and 1996. In contrast, the warm surface temperature of 1998 was complemented by the warmer-than-average bottom temperatures, resulting in the average temperature of the water column being the warmest in the last four years. The depth-averaged temperature in 1998, however, was still less than that observed in the warm years of the early 1980s.
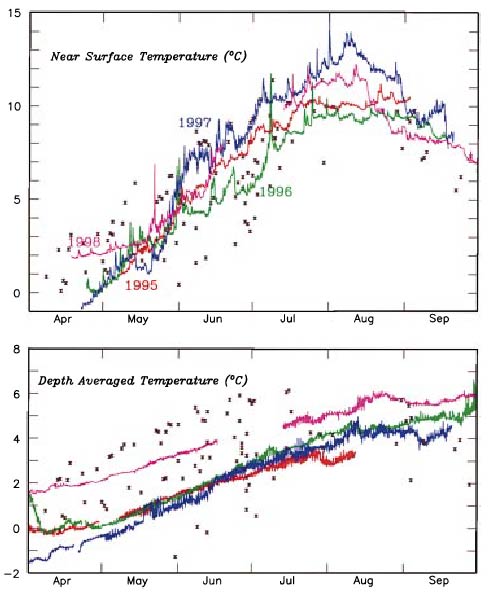
Figure 9. (a. upper) The seasonal signal of near-surface temperature at Site 2. Data from years when moorings were located at this site are indicated by coloured lines. Crosses represent data from hydrographic surveys between 1966 and 1994 collected within 25 km of Site 2. (b, lower) The depth-averaged temperature for the same data used in panel a.
During any given year, marked variations are superimposed on the spring-summer warming trend observed at Site 2 (Fig. 8). During 1995, ice persisted for more than a month; however, the water column was mixed to the bottom for only a short period in March. Advection of more saline water in the lower layer created a strong density gradient between the upper and lower layers (Stabeno et al., 1995). This effectively insulated the lower layer, limiting warming of the cold pool to less than 0.3°C month-1. The mixed layer was shallow (<20 m), because of the weak winds that summer (Fig. 3). During 1996, sea ice arrived early in February but remained for only a short time. Because strong winter winds mixed the water column after the ice departed, the density gradient was weak, and above-average wind mixing during the summer created a deeper surface layer than in 1995. Between April and August 1996, the bottom temperature warmed by about 1°C month-1. During 1997, ice was less persistent than in 1995; weak winds and strong heating resulted in a shallow, warm mixed layer. A storm in late May mixed the water column to 50 m, reducing the density gradient between the upper and lower layer. As in 1996, there was substantial warming (~1°C month-1) of the cold pool. In contrast to 1995 and 1997, ice arrived early in February 1998, during a period of weak winds. Thus, while the ice quickly cooled the upper layer, the lack of strong winds prevented mixing of fresh, cold water to the bottom. Only after the retreat of the ice in late February did wind energy become sufficient to mix the water column to the bottom. The mixing of the warm bottom water with the cold surface water produced above-average water column temperature for March. The water column then remained well mixed until late May. The weak stratification permitted a steady warming of the bottom layer by about 0.8°C month-1 from June to August.
In addition to temperature and salinity, fluorescence and chlorophyll were measured at the mooring sites. A phytoplankton bloom (indicated by fluorescence) occurred in March/April during 1995 and 1997, associated with the arrival and melting of sea ice (Fig. 8). The bloom began even though the water column was not stratified. In 1996 and 1998, when ice was present early in the year (January or February), the bloom occurred during May and appeared to last longer than observed in 1995 and 1997. During 1996 and 1998 the ice was present early in the year, when there was likely insufficient sunlight to initiate an ice-associated bloom.
While temperature data are more plentiful and define the seasonal cycle well, a significant part of the variability in density is due to salinity (Fig. 7). Using the same observations employed to delineate the envelope of variability of temperature at Site 2, we calculated the depth-averaged salinity there (Fig. 10a). The salinity in the vicinity of this location varies by almost 1.5 psu. The depth-averaged salinity was highest during 1966-1969 and 1977-1989. As already discussed, the years 1977-1989 had minimal ice coverage and thus less-than-average freshening due to ice melt. Historical records show that 1966 and 1967 were light ice years, while 1968 and 1969 were moderate (Overland and Pease, 1982). Salinity in 1995 was average (in spite of it being the most extensive ice year since 1976), but during 1996 and 1997 the water column was fresher. This was not solely due to freshening from melting sea ice, since both years had significantly less ice than 1995. There is evidence from satellite-tracked drifter tracks that during 1997 there was weaker-than-normal cross-shelf transport (not shown). Because the salinity of the water column near site 2 is a balance between the amount of ice melt (freshening) and the input of more saline water from the basin, a decrease in cross-shelf flux results in a fresher water column. The salinity of the water returned to a more moderate level in 1998, when there appears to have been enhanced cross-shelf transport.
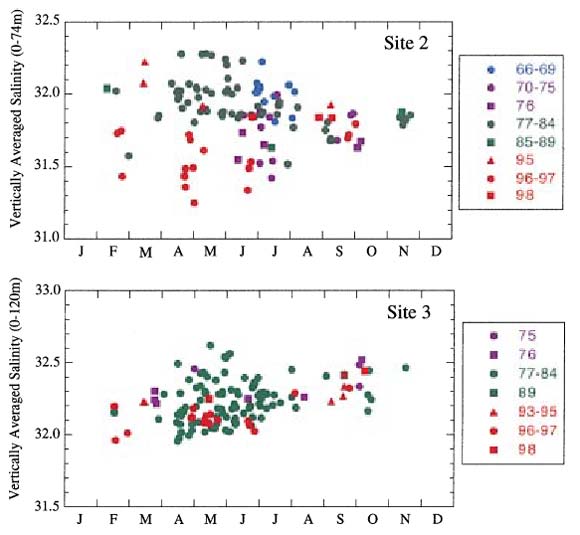
Figure 10. The depth-integrated salinity at Site 2 and at Site 3 from historical hydrographic casts. The casts from 1995 to 1998 are included. (a, upper) Measured near Site 2. (b, lower) Measured near Site 3.
Characteristics of outer shelf water temperature and salinity: Site 3
While not as extensive as the measurements at Site 2, data from Site 3 (at
water depth of 125 m over the outer shelf) provide insight into the response
of the outer shelf water to atmospheric, wind and ice forcing. Sea ice is less
common here than at Site 2. In the cold period (1972-1976), ice was present
for an average of 2-3 weeks a year, and during the warmer periods ice rarely
reached this location (Fig. 5). In only one of the mooring years (1995) was
ice blown over this site. During that year, a strong decrease in ocean temperature
was limited to a depth of 25 m, with weaker cooling occurring to ~80 m (Fig. 11).
Mean currents in this region are 5-10 cm s to the north-west (Stabeno
et al., 1999), so the cold water that results from the ice melt is
advected away. In 1997, ice extended into the vicinity of the mooring, although
it did not reach it. Remnants of the cold water from melting ice can be seen
in early April of that year (Fig. 11).
to the north-west (Stabeno
et al., 1999), so the cold water that results from the ice melt is
advected away. In 1997, ice extended into the vicinity of the mooring, although
it did not reach it. Remnants of the cold water from melting ice can be seen
in early April of that year (Fig. 11).
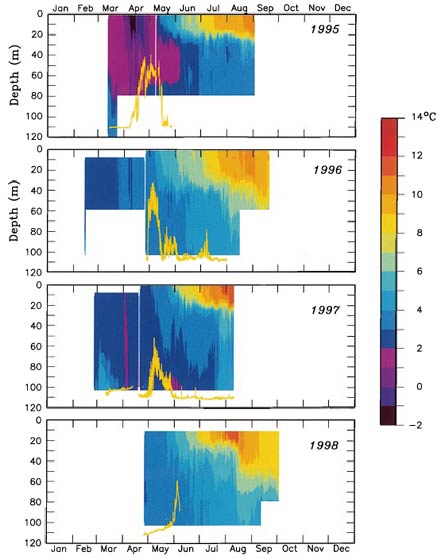
Figure 11. Temperatures measured at Site 3 (depth 125 m). Temperature
was measured every ~3 m in the upper 30 m and every 10 m below that. During 1995-1997, two moorings were
deployed in each year; during 1998, only a single mooring was deployed. The
yellow line is fluorescence or chlorophyll at a depth of ~10 m. Each year the
fluorescence is normalized to the maximum value of that year.
During the winter of most years, the water column at Site 3 was weakly stratified. Stratification owing to solar heating begins in May, with maximum temperatures occurring in late August. The depth of the mixed layer is similar to that observed at Site 2, but there is a greater transfer of heat below the upper mixed layer as a result of weaker stratification. The lack of moorings in autumn and early winter prevents us from describing the cooling of the water column. As at Site 2, the presence of ice can trigger an early spring bloom (1995). The spring bloom in 1996 and 1997 began in early May; in comparison, in 1998 it was delayed until late May by the strong mixing. In 1996 the bloom started at the same time at Site 2 and Site 3, but during 1998 the bloom at Site 3 appeared to be delayed by several weeks. In 1997, the bloom at Site 3 was much later than the ice-initiated bloom at Site 2.
Because ice is less common at Site 3, the major influence on salinity is cross-shelf advection. The variability of the depth-averaged salinity is less at Site 3 than at Site 2, and the marked freshening of the water column observed at Site 2 in 1996 and 1997 is not evident (Fig. 10b). There does appear to be a significant annual cycle at Site 3, with a systematic increase in salinity from spring until autumn. This increase is most pronounced in the lower part of the water column; salinity of the upper layer does not systematically change with the seasons. Unfortunately, there are no data taken during November-January when there must be a comparable decrease in salinity. This seasonal signal must result from variations in the onshelf flux of more saline water from the slope. The mechanism causing the annual cycle in salinity is not known, although instability in current along slope can result in onshelf flux (Stabeno and van Meurs, 1999).
Return to previous section or go to the next section