One of the defining characteristics of the eastern Bering Sea shelf is an annual advance and retreat of sea ice. Ice formation begins as early as November and can remain over the south-eastern shelf into June. The juxtaposition of the Aleutian Low and Siberian High typically produces winter winds from the north-east, freezing the sea water and pushing the resulting ice south-westward. Owing to fluctuations in these winds and in air temperature, large (hundreds of kilometres) interannual variability in the annual maximum extent of sea ice exists. The advection and eventual melting of ice play a critical role in the fluxes of heat and salt. The leading edge of the ice is continuously melting, introducing cold (about -1.7°C), relatively fresh water into the water column. Extensive mixing of the water column can occur beneath the moving ice, which overcomes the positive buoyancy (fresh water) produced by melting. Over the middle shelf, this mixing can extend to >80 m during periods of strong winds. The introduction of cold water throughout the water column results in the creation of a cold lower layer. As the surface warms from spring-summer heating, this isolates the cold bottom water, resulting in a feature known as the cold pool. This layer is 40-50 m thick with temperatures below 2°C, which persists through the summer, often warming only slightly.
These coupled atmosphere-ocean mechanisms have a significant influence on biota. An ice-edge phytoplankton bloom occurs in the marginal ice zone during the spring (Niebauer et al., 1990; Niebauer et al., 1995) and produces a large fraction (up to 65%) of the annual primary production over the shelf. The sequence of nutrients to phytoplankton to zooplankton appears to be critical for providing food to first feeding pollock larvae (Napp et al., 2000).
The timing of ice cover varies greatly among years. We obtained the position of the ice edge from the compact disk produced by the National Ice Center, the Fleet Numerical Meteorology and Oceanography Detachment, and the National Climatic Data Center. This data set contains information on the ice concentration and thickness from weekly satellite images from 1972 through 1994. For the data since 1994, we digitized the Alaska Regional Ice Charts, which are produced by the Anchorage Forecast Office of the National Weather Service.
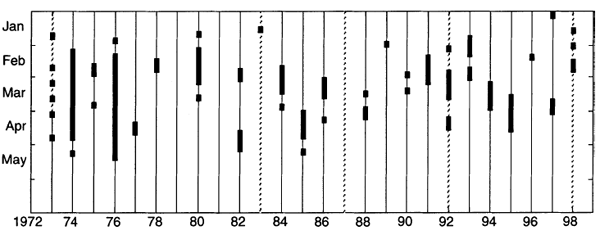
We focus our analysis of the temporal variability of sea ice on the middle shelf near Site 2 (Fig. 1). At this location, we have collected temperature, salinity, nutrient, fluorescence and other parameters since 1995 (discussed later in this article). The time of arrival, departure and the persistence of sea ice at this location (Fig. 4) indicates that years with the most extensive ice coincided with a strong negative PDO (Fig. 2). Sea ice has arrived at this location as early as January and remained as late as mid-May. Between 1979 and 1981, ice was largely absent from the middle shelf near Site 2. These were years when extensive water property observations were collected as part of PROBES (Coachman, 1986); these observations led to much of the present understanding of characteristics and processes over this shelf. Beginning in the early 1990s, sea ice once again became more common in this region, although not to the extent observed in the early 1970s. Neither the PDO nor ENSO accounts for all the fluctuations in sea ice over this region. In particular, the manifestation of El Niño at high latitudes is not consistent. There was no ice at Site 2 during two of the five El Niño events that occurred since 1972 (Fig. 4), and the presence of ice during other years was intermittent. These characteristics are not, however, uncommon to this time series; ice was also intermittent or absent in non-El Niño years. These results are consistent with Niebauer et al. (1999), who found only a weak negative correlation between ENSO and sea ice extent.
Figure 4. The timing of arrival and departure of sea ice at Site 2 is indicated by the dark bars. Dotted vertical lines indicate periods when an El Niño was occurring on the equator.
To characterize the temporal variability in the spatial pattern of sea ice (Fig. 5), we divided the time series of ice observations into three subsets based on the regime shifts (Ohtani and Azumaya, 1995; Trenberth and Hurrell, 1995). These are 1972-1976 (cold period), 1977-1988 (warm period), and 1989-1998 (cool period). A marked difference exists in persistence and spatial distribution of ice between the first (cold) period and the latter two periods. During the first period, ice covered the shelf out to and over the upper slope and remained around St. Paul Island for more than a month. During the later years, ice did not extend as far seaward, and its residence time was typically 2-4 weeks less than during the cold period. The differences between the two latter regimes are more subtle, but still evident. Along 59°N, during 1989-1998, there were 2-4 weeks more ice than during 1977-1988. Surprisingly, north of St. Lawrence Island and along the west coast of Alaska north of Nunivak Island, there were 1-2 more weeks of ice cover in the warm period than in the cooler, third period. This resulted from either later arrival or more rapid retreat of sea ice over the northern Bering Sea shelf during 1989-1998, in agreement with observations from native Alaskans, who have lived in this area for generations. It should be noted that Site 2 is in a region of highly variable ice cover duration, and while ice usually reaches this location, it is often nearing its southernmost extent.
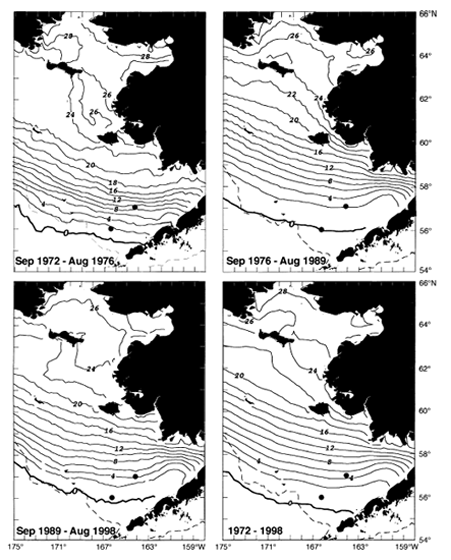
Figure 5. Contours of the number of weeks that sea ice was present over the eastern Bering Sea shelf. The average ice coverage during (a) cold period, (b) warm period, (c) cool period, and (d) 1972-1998. Solid circles denote Sites 2 and 3.
Marked differences also occurred in the ice distribution and extent along the Alaskan Peninsula. During the cold period, ice extended seaward, sometimes nearly to Unimak Pass, whereas in the other two periods contours of ice persistence were warped landward into inner Bristol Bay. This pattern is likely related to variations of inflow and/or temperature of the Gulf of Alaska shelf water, which flows through Unimak Pass onto the Bering Sea shelf. Either condition would move the thermodynamic limit of ice farther into Bristol Bay.
Return to previous section or go to the next section