U.S. Dept. of Commerce / NOAA / OAR / PMEL / Publications
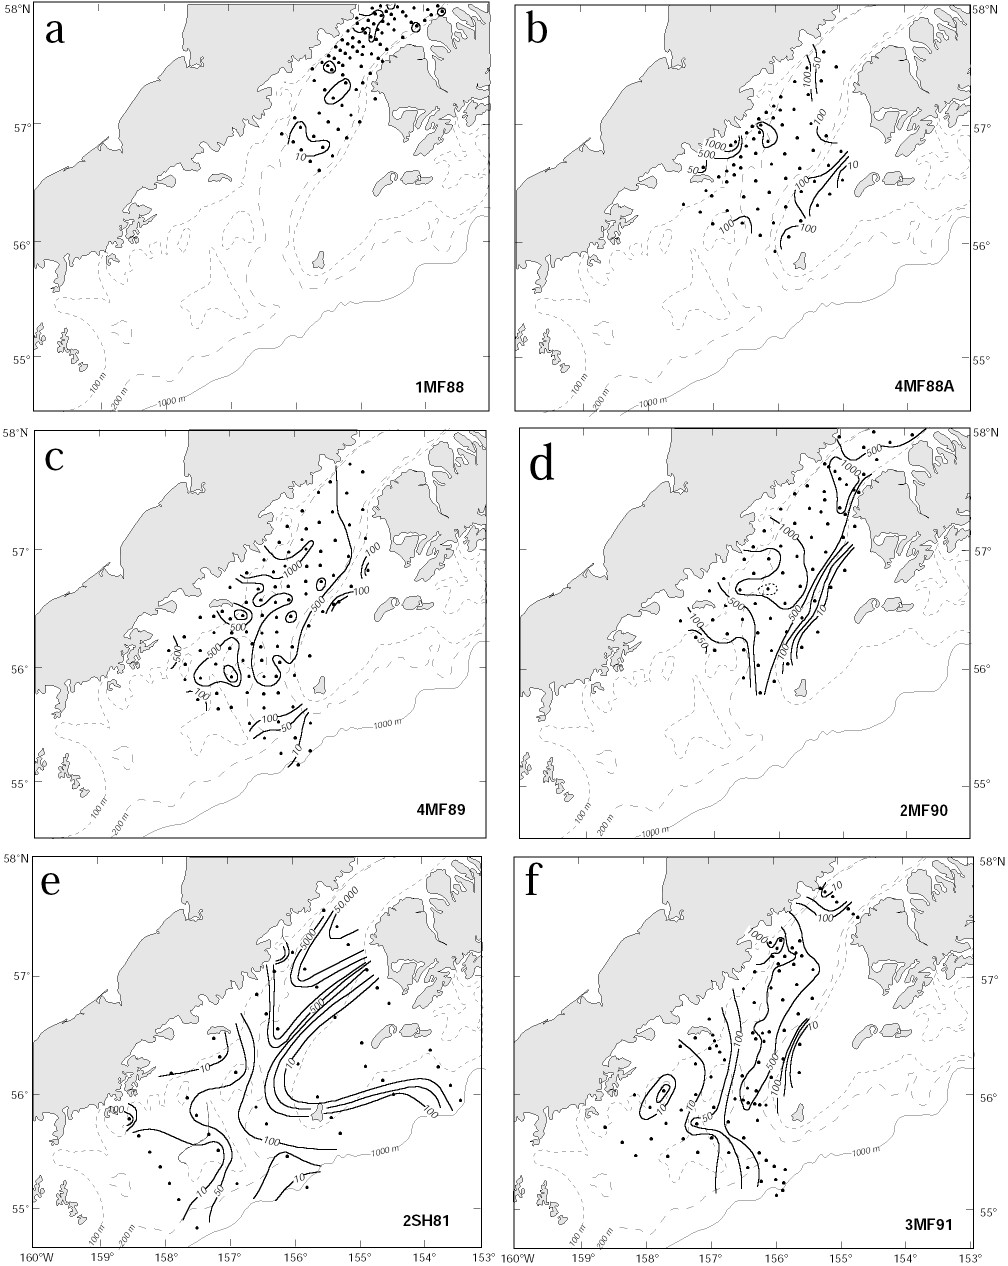
The interaction of larvae shortly after hatching with the ACC, Ekman drift and eddies plays a role in creating patches. The characteristics of larval distributions suggest that these larval patches can be organized into three categories, those (i) generated by interaction with time-dependent flow, (ii) found near Sutwik Island, and (iii) associated with eddies. Representative distributions are shown in Fig. 4, and are discussed below.
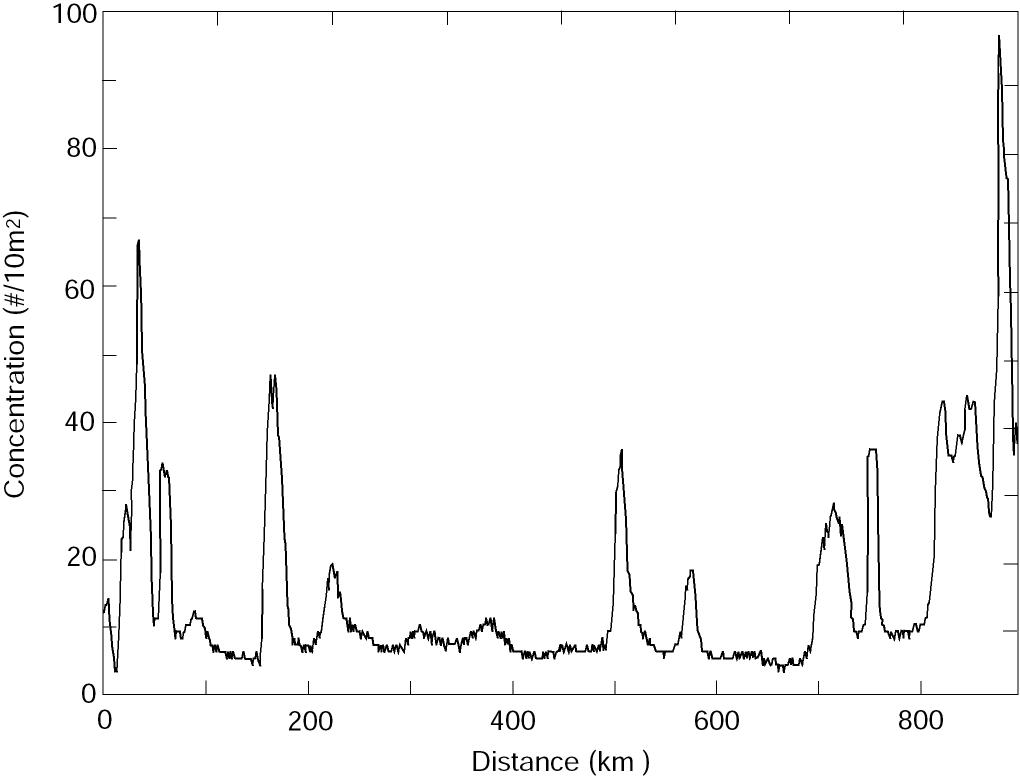
Patches generated by time-dependent flow A primary mechanism generating patches is the interaction of newly hatched larvae with the vertical shear in the velocity field of the ACC. If there was no vertical shear in the current, the eggs and larvae would be moved together. With a uniform egg distribution no patches could be created. We used a simple model to explore the variability in larval concentration created by a varying baroclinic current given a constant supply of larvae. We assumed eggs hatched at a constant rate (1 egg/10 m2 each hour per kilometer at 200 m depth) along 20 km of the sea valley. Within 24 h the resulting larvae migrated to the upper 50 m; the larval population was not modified by mortality or diffusion. The resulting patchiness did not change significantly when migration time was extended to 48 h. In this model, we assumed no along-axis variation in current. Moored current observations (April-June, 1991; Stabeno et al., 1995) provided the time series of speed that was used to advect the larvae. The current was low-pass filtered and contains no tides, since the tides are largely barotropic in this region. The vertical dependence of speed was 0 at the bottom (z = 200 m), increased linearly to 50 m, and was capped by a mixed layer (z < 50 m) moving as a slab. This structure is a first order approximation to observed conditions (Schumacher et al., 1989). The resulting concentration of larvae along the axis of the ACC varied by an order of magnitude (Fig. 5), with segments of both low variability (200-500 km) and high variability (700-900 km or 0-200 km). The sections where larval concentration was relatively constant result in a low P, while the highly variable sections result in a high P. This mechanism is a likely cause of the high variability evident in P during the early larval stage (Fig. 3). Beginning with a uniform distribution of eggs, varying current regimes with a vertical shear can produce very different larval concentrations. Years when the currents are weak and relatively constant produce larval concentrations with small P. Alternately, years with strong, variable currents produce larval concentrations with large P. An example of the two-dimensional variability resulting from this process is shown in Fig. 4a.
Figure 5. Concentration of newly hatched larvae as a function of distance downstream from midpoint of the hatching distribution from the advective model.
Other manifestations of time-dependent flow can form larval patches. Patches have been associated with meanders in the ACC (Incze et al., 1989; Vastano et al., 1992). Interaction of storms with the mountainous coast together with ageostrophic winds in Shelikof Strait proper results in a wind-driven flow convergence off Wide Bay (Fig. 1; Schumacher and Kendall, 1991). This mechanism can create larval patches, although such a patch has no physical dynamics that would continue to maintain it after the wind event. The contribution of either of these mechanisms to the observed distribution of larvae cannot be assessed.
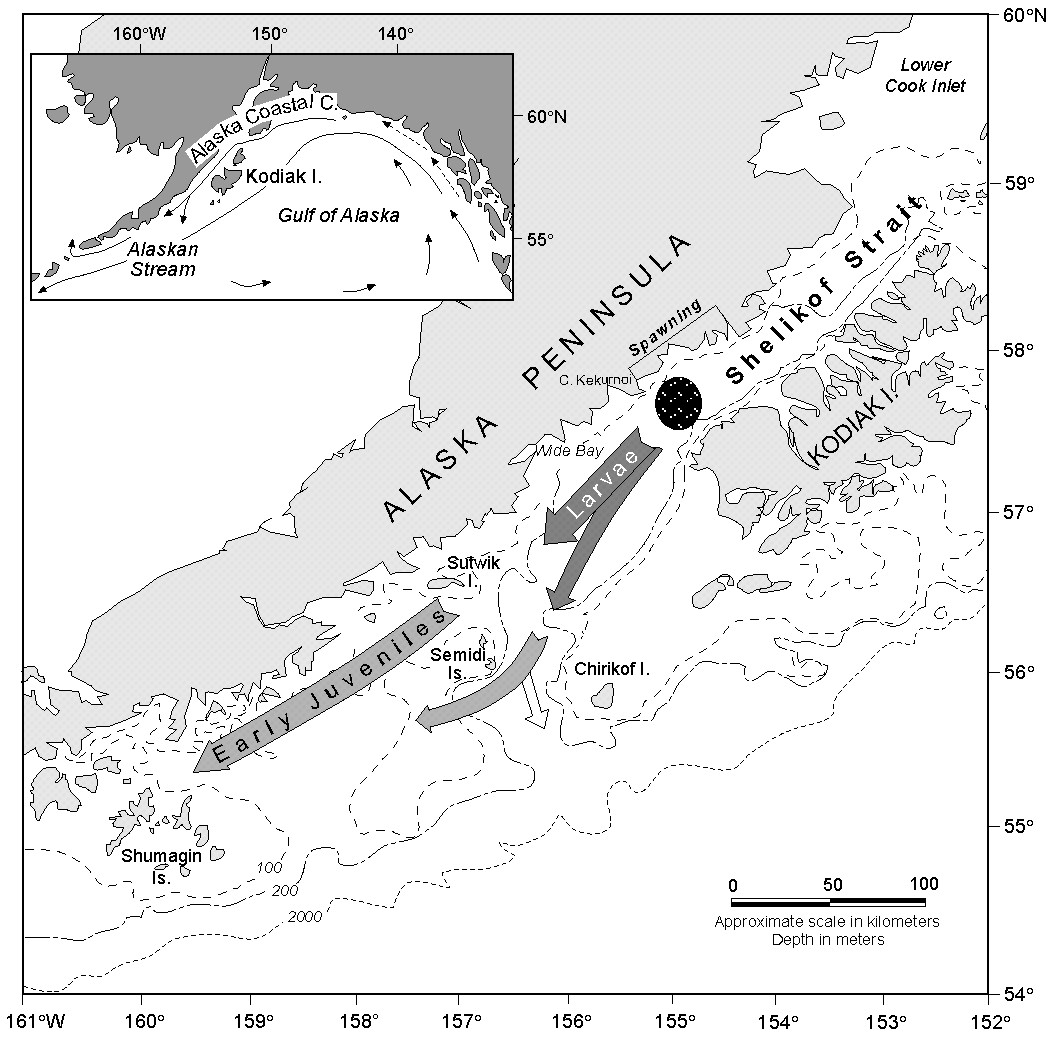
Patches near Sutwik Island High concentrations of larvae are often observed in the vicinity and to the northeast of Sutwik Island (Figs 4b and 4c). Evidence of accumulation of material near the island is not limited to larval concentration from ichthyoplankton surveys. Currents from a hydrodynamic model were used to advect larvae; the resulting modeled larval distributions often showed an accumulation near Sutwik Island (Hermann and Stabeno, 1996; Hermann et al., 1996b). Further, satellite-tracked drifting buoys deployed near Cape Kekurnoi were commonly advected to the vicinity of Sutwik Island.
The Sutwik Island patches resulted from a combination of hatching location (Fig. 1), Ekman flow, mean current and topography (Hermann and Stabeno, 1996). A weak (~10 cm s-1) flow along the Alaska Peninsula has been measured by both current meters and satellite-tracked drifting buoys (Kim and Kendall, 1989; Schumacher et al., 1989). Drifting buoys usually drifted toward Sutwik Island where net speeds diminished (Schumacher and Kendall, 1995), suggesting that flow stagnates there. This is due, at least in part, to the change of water depth from the sea valley (>250 m) to plateau (<150 m). The flow onto this plateau is determined by both baroclinic structure and current strength (Spitz and Nof, 1991).
Superimposed on this mean flow are wind-driven events. Between April and June, the mean wind is toward the southwest, with nearly three-fourths of the variance occurring on this axis (Macklin et al., 1993). The passage of storms results in Ekman transport in the upper layer that fluctuates between on- and offshore flow; these were evident in a current record (1985) from a mooring south of Wide Bay (not shown). During May 1985, three events of onshore flow occurred resulting in a total of 13 days of coastal convergence. In contrast, there were only 3 days of divergent flow.
Since most spawning occurs near the Alaska Peninsula off Cape Kekurnoi, larvae are ideally situated for being transported to Sutwik Island. Flow shoreward of the sea valley carries larvae along the coast where the shelf widens and winds seasonally decrease. All along this pathway, Ekman flow events concentrate larvae near the coast (Hermann et al., 1996b). Larvae that hatch later provide a continuing supply of larvae adding to those that arrived earlier. The lifetime of a patch is dependent upon the winds. When winds reverse, the resulting offshore flow transports larvae away from the coast. In a year when these wind conditions dominate, a patch would not be expected near Sutwik Island.
Patches associated with eddies During three separate occasions high larval abundances were observed in eddies (Bograd et al., 1994; Schumacher et al., 1993; Vastano et al., 1992). The presence of larvae in an eddy (Fig. 4d) can result from their residence in the water during formation and/or from subsequent hatching and rising into the eddy. During the spring, two to three eddies are typically formed each month (Bograd et al., 1994). The fraction of water (percentage of larval population) incorporated into an eddy is small compared to that of the ACC (total larval population). For an eddy of radius 10 km and 100 m deep, the volume is 3 × 10¹⁰ m3, while volume transport in the ACC (<100 m) is ~0.4 × 10⁶ m3 s-1. The three eddies formed per month contain <10% of the water passing through the area in the ACC each month. Hatching into an eddy likely provides the majority of larvae found there. In model simulations, eddies remain stationary off Cape Kekurnoi 3-6 days, thus from 30%-60% of each month an eddy is present into which larvae may hatch.
Larval patches associated with eddies are often larger than the eddy itself (Schumacher et al., 1993), suggesting some leakage of larvae occurs. How long larvae remain within an eddy depends upon the strength, size relative to the Rossby radius, and translation speed of the eddy (Holloway et al., 1986). Leakage of larvae from an eddy is due to diffusion-like effects, interaction with background flow field, and wind. Since larvae are predominantly found in the upper 50 m, larvae may be removed from the eddy by Ekman transport.
In the Shelikof sea valley, eddies have retained drifting buoys for weeks, with the buoys escaping an eddy only when the eddy interacted with bathymetry and dissipated. The majority of dispersion occurs as an eddy spins down due to this interaction with bathymetry. The lifetime of an eddy in the sea valley is not known. The longest observed duration was 16 days (Schumacher et al., 1993). While in an eddy, larval concentration remains high, but once the eddy spins down, diffusion dominates and larvae are quickly dispersed.
Return to previous section or go to next section