U.S. Dept. of Commerce / NOAA / OAR / PMEL / Publications
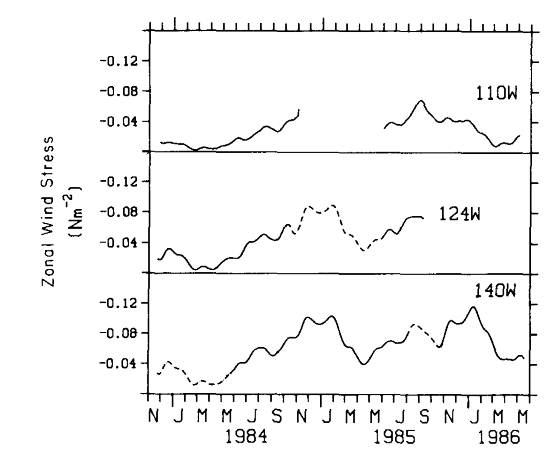
Figure 5 shows time series of low passed zonal wind stress at 110°, 124.5° and 140°W from the mooring data. The dashed lines show where data gaps have been filled by an interpolation procedure described in the next section. Meridional winds are not presented since they are generally weaker (e.g., Halpern 1987a), relatively ineffective at exciting low-frequency variability (e.g., Gent et al. 1983), and do not enter into the zonal momentum balance which will be diagnosed in the next section.
Figure 5. Zonal wind stress data at the mooring sites smoothed with a 51-day Hanning filter. Dashed lines are data interpolated according to a procedure outlined in section 5.
Wind stress has been calculated from daily averaged data using a methodology
outlined in Large
and Pond (1982), then smoothed with a 51-day Hanning filter. A constant
stress, neutrally stable boundary layer has been assumed and the 4 m winds extrapolated
to 10 m for incorporation into the bulk formula. The drag coefficient and air
density are set at 1.2 Ũ 10 and 1.2 kg m,
respectively. Uncertainty in the wind stress is mainly due to imprecise knowledge
of the drag coefficient, which can lead to bias errors of 20%. For typical trade-wind
speeds, this is equivalent to an error of O(10
and 1.2 kg m,
respectively. Uncertainty in the wind stress is mainly due to imprecise knowledge
of the drag coefficient, which can lead to bias errors of 20%. For typical trade-wind
speeds, this is equivalent to an error of O(10 N m).
N m).
Concentrating on uninterpolated data (solid curves) in Fig.
5, one notes a clearly defined seasonal minimum in boreal spring at all
three longitudes. At 140°W, seasonal maxima occur from November to January consistent
with Meyers'
(1979) climatological analysis. At 110°W in 1985, a strong August-September
maximum occurs but no maximum in the subsequent fall-winter. Wind stress generally
increases from east to west, with a mean of about 25 Ũ 10
N m at 110°W to 70 Ũ 10
N m at 140°W, values which are comparable
to the climatological means (Fig. 1). Variability
also increases westward and is dominated by the 1 cycle per year harmonic which
has an amplitude of about 15 Ũ 10 N m
at 110°W and 25 Ũ 10 N m
at 140°W. We also note in Fig. 5 that there is
a tendency for easterly stress to be stronger in 1985-86 relative to 1983-84.
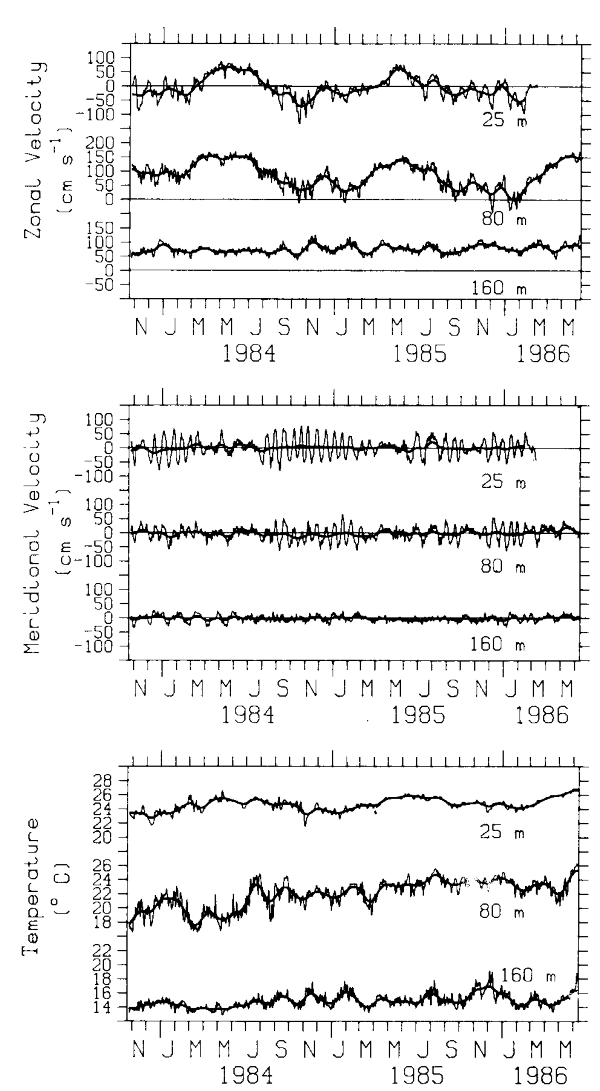
Figure 6 displays times series of smoothed zonal velocity at 110° and 140°W for the period November 1983-May 1986. Data from 124.5°W are not shown, since they are not greatly different in character.
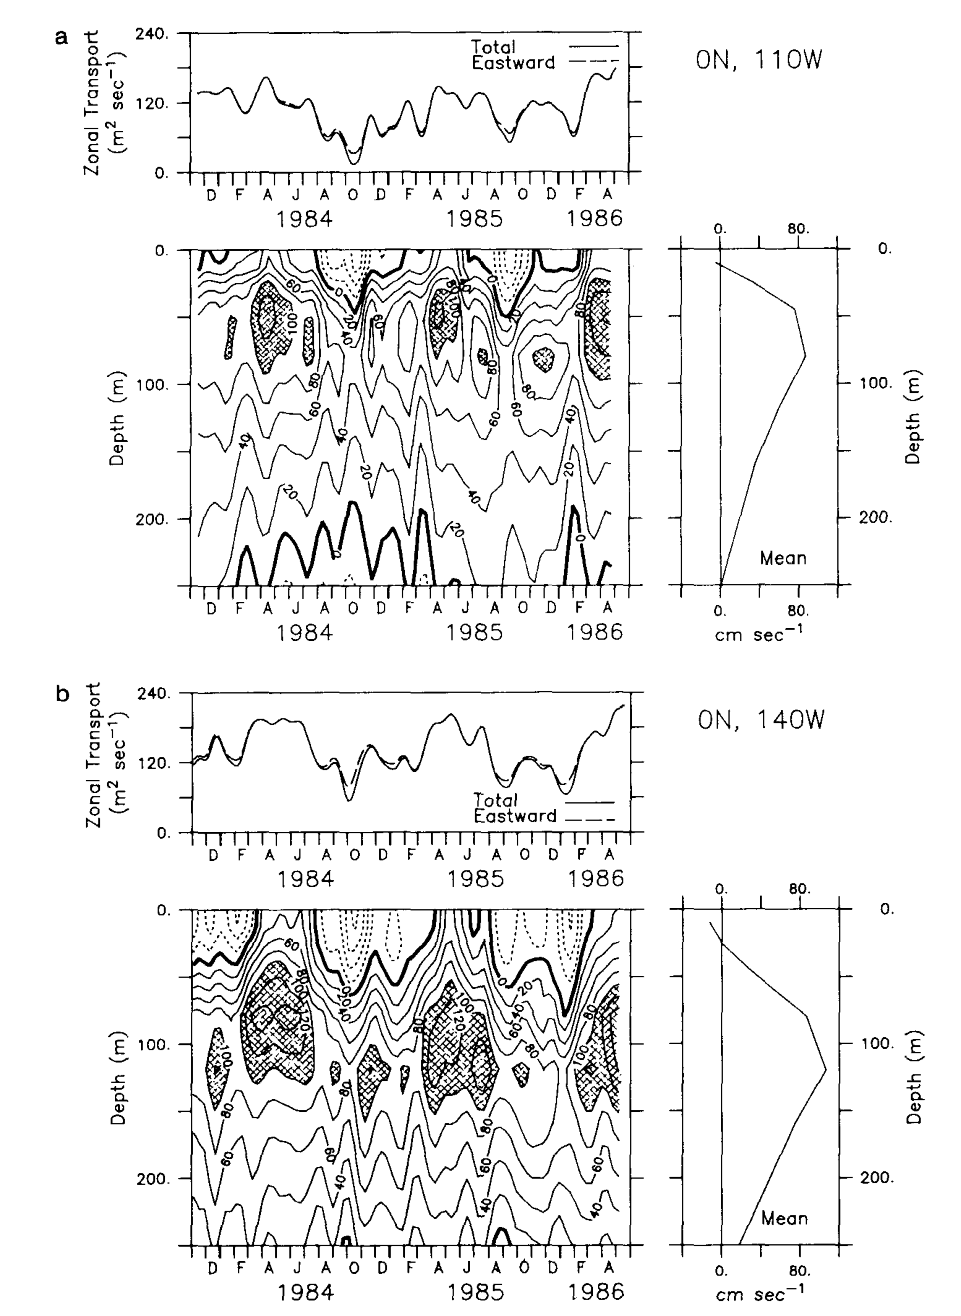
Figure 6. Equatorial current and transport time series smoothed with a 51-day
Hanning filter at (a) 110°W and (b) 140°W. Dashed contours indicate westward
flow; cross hatching indicates eastward flow >100 cm s .
Means calculated from a six-parameter regression analysis (see section 3) are
shown on the right. Total (eastward) transport per unit width in the upper 250
m is indicated by the solid (dashed) line.
.
Means calculated from a six-parameter regression analysis (see section 3) are
shown on the right. Total (eastward) transport per unit width in the upper 250
m is indicated by the solid (dashed) line.
Figures 2 and 6
show that the Equatorial Undercurrent is found in the upper thermocline which
shoals from west to east. Maximum mean speeds are 107 cm s
at 120 m (140°W) and 88 cm s at 80 m (110°W).
Mean westward speeds in the South Equatorial Current (SEC) at 10 m are 12 cm
s (140°W) and 4 cm s
(110°W).
The EUC core undergoes an annual migration in depth at both longitudes. At 110°W the core migrates from about 50 m in the boreal spring when EUC speeds are largest, to 80 m in the fall when speeds are weakest (Fig. 6a); at 140°W, similar vertical excursions occur between about 80 and 120 m (Fig. 6b). Variability above the core is dominated by the annual cycle which diminishes rapidly below 100 m (see also Halpern 1987a). Eastward flow near the surface occurs in boreal spring, a phenomenon documented nearly a century ago from analysis of ship-drift data (Puls 1895). Strong westward flow in the South Equatorial Current (SEC) and weak eastward flow in the EUC occur in boreal summer and fall.
Currents in Fig. 6 also show a pronounced oscillation
at periods of 60-90 days below the EUC core at both longitudes, with typical
peak-to-peak amplitudes of about 20 cm s
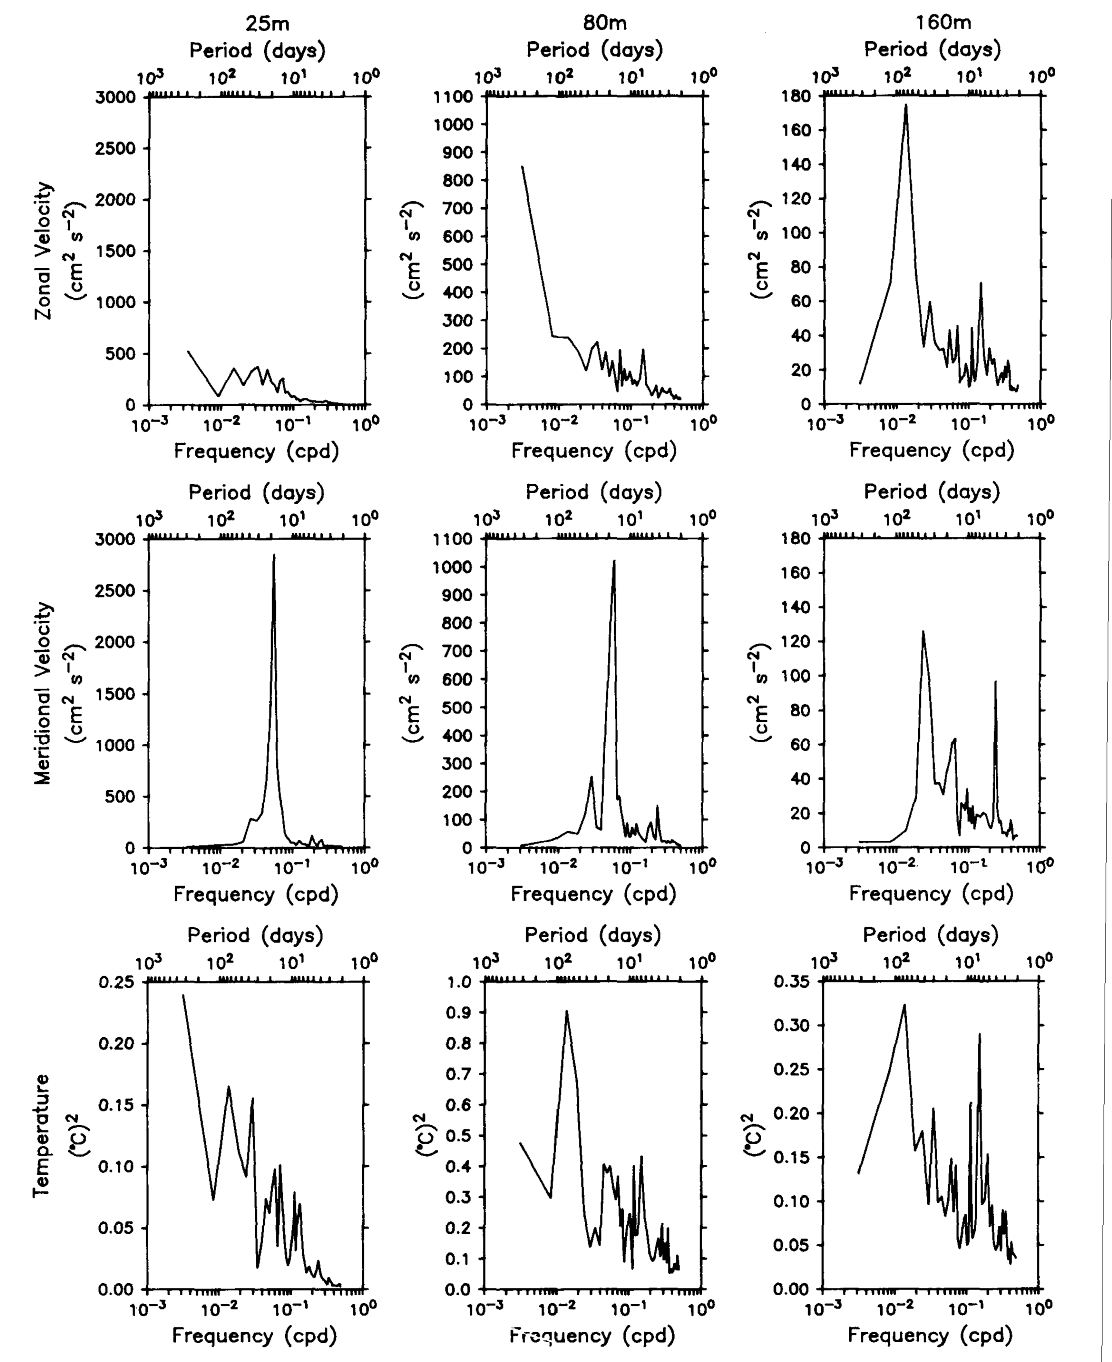
. There is energy at 60-90 day periods above the EUC core as well (q.v., the
spectra in Fig. 4), though in the time series
it is obscured by the more energetic annual cycle. No similar fluctuation is
obvious in either the winds (Fig. 5) or meridional
velocity (Fig. 3b).
Figure 7 shows in general significantly nonzero correlation with 90% or greater confidence for zonal currents between 110° and 140°W. At 25 m where the annual cycle is prominent, currents at 110°W are most highly correlated with those at 140°W 14 days later, suggesting westward phase propagation. The uncertainty in the magnitude of this phase lag is large however, as it is for the more closely spaced station pairs 110°/124°W and 124°/140°W. On the other hand, the westward direction of phase propagation may be significant since all the correlation functions at 25 m are skewed toward positive lags.
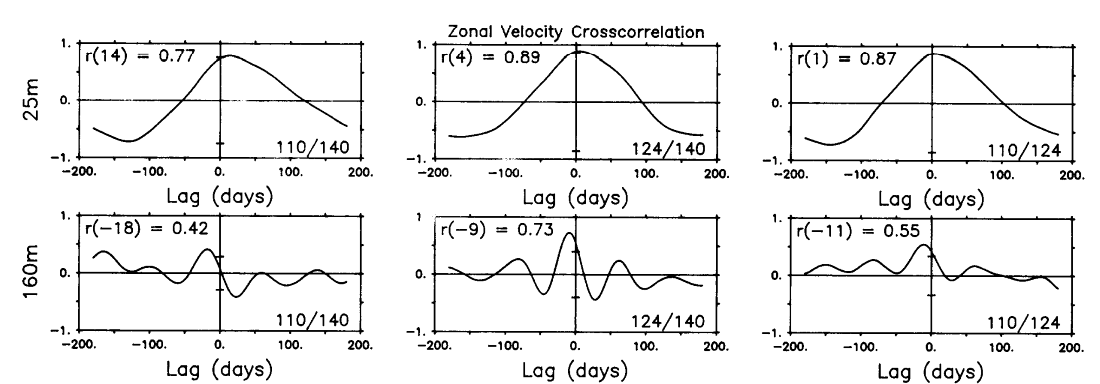
Figure 7. Cross-correlation analyses for zonal currents at 25 and 160 m depth between 110°-124.5°W, 110°-140°W and 124.5°-140°W. Data have been demeaned and detrended. Maximum correlation (r) and corresponding lag in days is shown in upper left of each panel. Positive (negative) lag means that the second time series lags (leads) the first. Heavy tick marks indicate 90% confidence limits for the null hypothesis calculated using the integral time scale to estimate degrees of freedom (Davis 1976). Integral time scale is based on correlation calculations for lags up to ą2 years and is about 5-6 months at 25 m and 1-2 months at 160 m; only lags to ą180 days are plotted for brevity.
Figure 7 shows eastward progression of the 60-90
day velocity signal at 160 m (representative of the depth range 120-250 m) in
contrast to the apparent westward progression of the annual cycle above the
EUC core. The 160 m currents at 110°W lag those at 124° and 140°W by 11 and
18 days respectively, and currents at 124.5°W lag those at 140°W by 9 days.
Thus, the signal propagates eastward at an average speed of 214 cm s
between 140° and 110°W, with slightly higher speeds between 140° and 124.5°W
(221 cm s) and lower speeds between 124°
and 110°W (169 cm s). The uncertainty in
these phase speed estimates is about 20% based on a series of calculations taking
three one-year overlapping segments of data at each of the three zonal separations
and computing lags at maximum cross-correlation. Thus, these phase speeds cannot
be statistically distinguished from those of first baroclinic mode Kelvin waves,
which would have speeds of 246 cm s at 150°W
(Rothstein
1984) and 210 cm s at 110°W (Hayes
and Halpern 1984), respectively. However, they are generally higher than
the corresponding second mode speeds of 146 cm s
(150°W) and 130 cm s (110°W). The zonal
wavelength, estimated by assuming a period of 75 days and a phase speed of 210
cm s , is approximately 120 degrees of longitude,
which is comparable to the width of the equatorial Pacific!
Zonal transport per unit width in the upper 250 m, shown in the upper panels
of Fig. 6a and 6b,
is on average 105 m s
at 110°W and 138 m s
at 140°W. Total transport is nearly identical to the eastward transport of the
EUC because the surface SEC, when present, is generally weaker than 50 cm s
and shallower than 50 m. The total transport is also an order of magnitude larger
than the 10 m s
predicted by the Sverdrup calculation (Fig. 1c).
Part of the discrepancy is due to the shallow depth range of the mooring data,
although as will be shown in section 5, most of the Sverdrup pressure signal,
and presumably therefore transport signal, is found in the upper 250 m.
s
at 110°W and 138 m s
at 140°W. Total transport is nearly identical to the eastward transport of the
EUC because the surface SEC, when present, is generally weaker than 50 cm s
and shallower than 50 m. The total transport is also an order of magnitude larger
than the 10 m s
predicted by the Sverdrup calculation (Fig. 1c).
Part of the discrepancy is due to the shallow depth range of the mooring data,
although as will be shown in section 5, most of the Sverdrup pressure signal,
and presumably therefore transport signal, is found in the upper 250 m.
Zonal transport exhibits an annual variation which is consistent with the current
variations in the upper 100 m. Like the winds, it has increasing amplitude towards
the west (31 m s
at 110°W versus 44 m s
at 140°W). Phase also increases towards the west with 110°W leading 140°W by
19 days, which though highly uncertain, is comparable to the 14-day lead inferred
from the 25-m cross-correlation analysis.
Figure 8 shows isotherm depths and sea surface temperature (SST) at 110° and 140°W. Temperature at 10 m has also been plotted to provide an indicator of SST variability across gaps in the SST record. Mean SST is warmer by 1.9°C at 140°W (25.0°C) than at 110°W (23.1°C). At both locations a well-defined annual cycle is seen which is consistent in amplitude and phase with Horel's (1982) analysis of historical data. The mean position of the upper thermocline, roughly delineated by the 15°-20°C isotherms, is deeper by about 50 m at 140°W compared to 110°W. Annual variations in thermocline depth at both locations are weak and tend to be obscured by O(10 m) depth coherent fluctuations at periods of 60-90 days. These intraseasonal fluctuations are generally more pronounced at 140°W than at 110°W, especially in late 1984 and early 1985. Cross-correlation analysis in the thermocline at 110°, 124.5° and 140°W indicates that the oscillations propagate eastward with phase speeds similar to those inferred from the velocity cross-correlation at 160 m. Moreover, zonal currents and temperature variations are nearly in phase at periods of 60-90 days as indicated by the velocity and temperature cross-correlation at 160 m (Fig. 9). This phase relationship is consistent with an equatorial Kelvin wave origin for the observed variability.
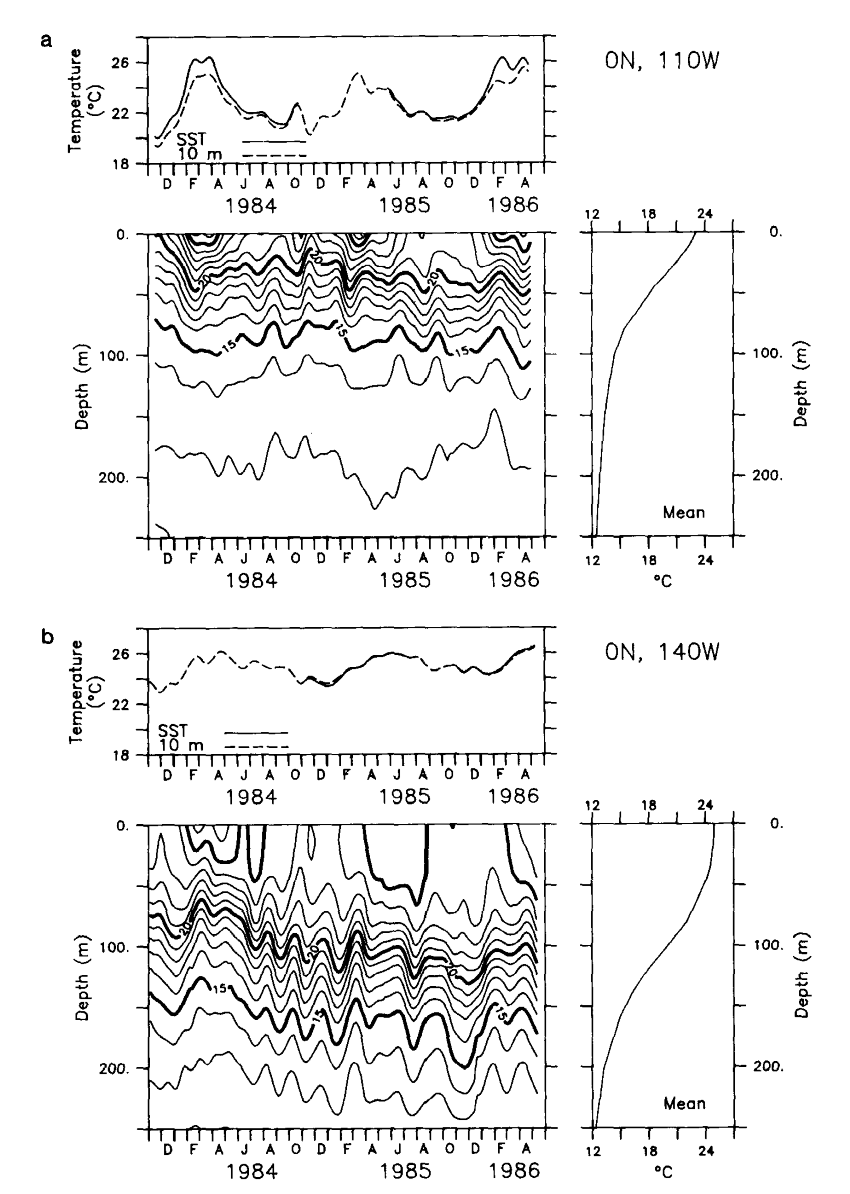
Figure 8. Time series of isotherm depths and SST smoothed with a 51-day Hanning filter at (a) 110°W and (b) 140°W. Means calculated from a six-parameter regression analysis (see section 3) are shown on the right.
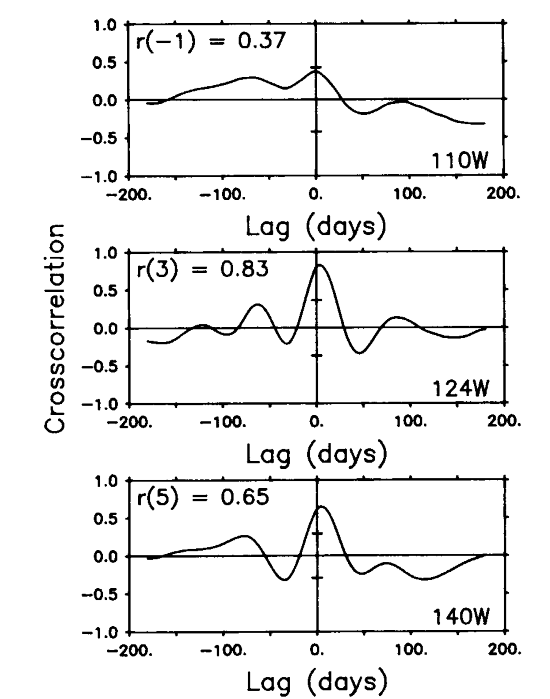
Figure 9. Cross-correlation analyses of currents and temperature at 110°, 124.5° and 140°W from a depth of 160 m. Positive (negative) lags imply that temperature leads (lags) zonal velocity. Format is otherwise as in Fig. 7.
Figure 8b shows an interannual deepening of the thermocline at 140°W by 30-40 m from late 1983 to late 1985. Interannual changes in SST and 10 m temperatures are also evident; both were cooler in late 1983 compared to late 1985 by about 1°C at 140°W and by about 2°C at 110°W. Our regression fit to these temperature data indicates linear trends significantly nonzero with 95% or greater confidence. This is consistent with the analysis of Wyrtki (1984) and Kessler and Taft (1987) who found that the eastern and central equatorial Pacific were unusually cool after the 1982-83 El Niņo.
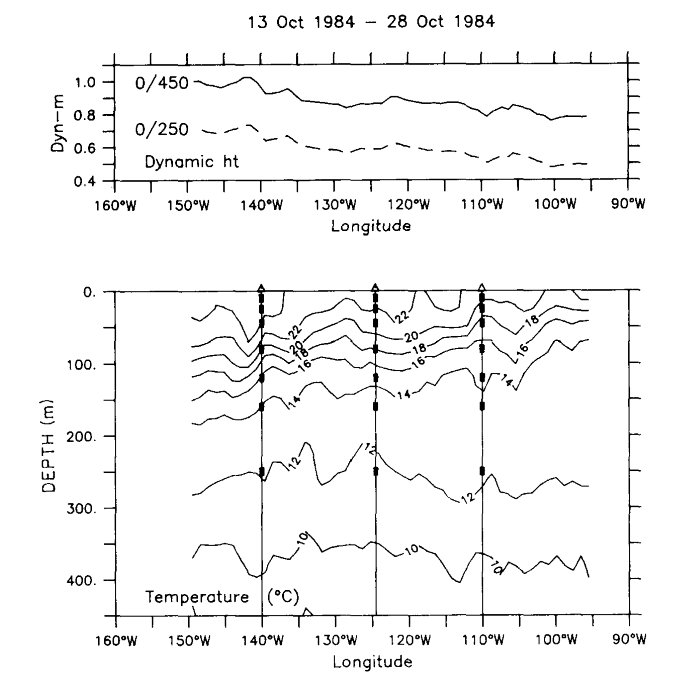
Dynamic height has been calculated from observed temperatures and a mean T-S relationship for each of the mooring sites. The T-S curves are derived from an ensemble of about ten EPOCS CTD casts. With the exception of El Niņo periods, when low surface salinities can lead to large positive biases, the error involved in estimating dynamic height in this manner is random and about 2 dyn cm in magnitude (Kessler and Taft 1987).
Our temperature measurements to 250 m should capture much of the signal in near surface dynamic height along the equator. For example, zonal dynamic height gradients at the surface relative to 250 m are visually indistinguishable from those relative to 450 m for the October 1984 XBT section shown in Fig. 2. Moreover, Mangum and Hayes (1984) observed that below 200 m, the mean dynamic height difference relative to 1000 db between 110° and 150°W was about 1 dyn cm, which was not statistically different from zero at the 95% level of confidence. However, they noted that the time variability in dynamic height has a deep signature which could be due to low baroclinic mode waves. Kessler et al. (1985) showed that 0/200 m dynamic height estimates contain about 52% of the variance (i.e., 72% of the amplitude) of 0/1000 m dynamic height estimates as determined from Hawaii-Tahiti Shuttle CTD data. Thus, we expect that our 250 m reference level will lead to relatively small errors in estimates of mean dynamic height gradients; however, the amplitude of dynamic height fluctuations calculated relative to 250 m may be too low by as much as 25%-30%.
Figure 10 shows dynamic heights relative to
250 m at 110° and 140°W. In the mean, surface dynamic height is 17 dyn cm higher
at 140°W than at 110°W. For comparison with Sverdrup pressure, depth integrated
dynamic height increases by about 1.4 Ũ 10 N m from 110° to 140°W, comparable to values
in Fig. 1b. Variability is greater at 140°W than
at 110°W at all depths above 250 m, and, as expected from the temperature data
in Fig. 8, the annual cycle is relatively weak,
e.g., 1.5 dyn cm at 110°W and 2.5 dyn cm at 140°W for 1 cpy surface height amplitudes.
The trend at 140°W towards higher dynamic heights is associated with the deepening
thermocline (Fig. 8b) and is significant at the
99% level of confidence.
N m from 110° to 140°W, comparable to values
in Fig. 1b. Variability is greater at 140°W than
at 110°W at all depths above 250 m, and, as expected from the temperature data
in Fig. 8, the annual cycle is relatively weak,
e.g., 1.5 dyn cm at 110°W and 2.5 dyn cm at 140°W for 1 cpy surface height amplitudes.
The trend at 140°W towards higher dynamic heights is associated with the deepening
thermocline (Fig. 8b) and is significant at the
99% level of confidence.
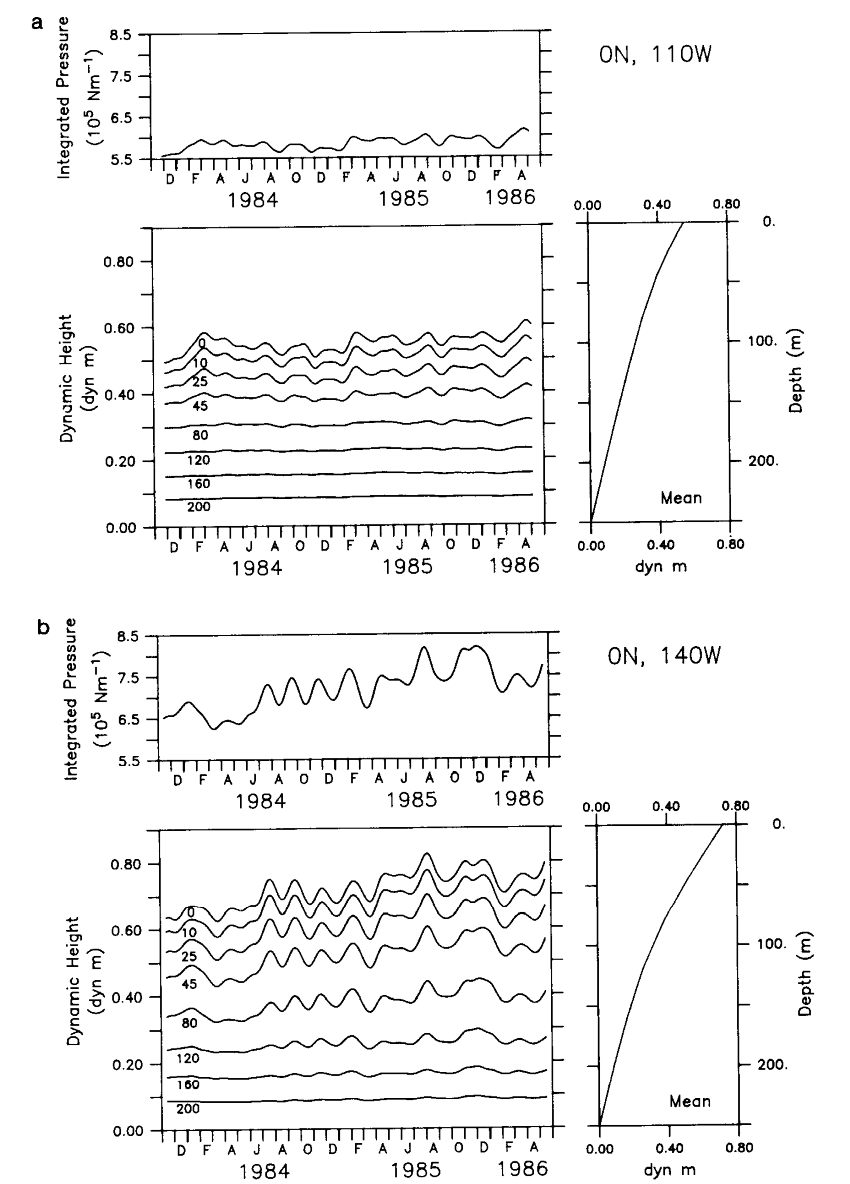
Figure 10. Dynamic height variations relative to 250 m smoothed with a 51-day Hanning filter at (a) 110°W and (b) 140°W. Means calculated from a six-parameter regression analysis are shown on the right.
As with temperature, the 60-90 day periodicity is very prominent in the dynamic height time series. At the surface this oscillation has peak-to-peak amplitudes of about 10 dyn cm at 140°W, as compared with about 4 dyn cm at 110°W. It is most pronounced and regular at 140°W during the second half of 1984 and early 1985, and least well developed over the first 6 months of record. Like temperature, variability in dynamic height propagates eastward nearly in phase with zonal velocity at periods of 60-90 days.
Go back to previous section or forward to next section