U.S. Dept. of Commerce / NOAA / OAR / PMEL / Publications
We used COADS SLP data to examine the climatological seasonal march and ENSO period signals from 1946-1993. Following Rasmusson and Carpenter's (1982) SST and wind study, we constructed a SLP anomaly (SLPA) composite event. We find statistically significant patterns in this composite. These are most easily examined by normalizing the composite SLPA by the standard deviation of the local non-seasonal variability, SLPAN, a variable proportional to the Normal-z statistic. This normalization facilitates the evaluation of significance between tropical and extra-tropical signals, since extra-tropical SLPA variability is much larger than tropical variability.
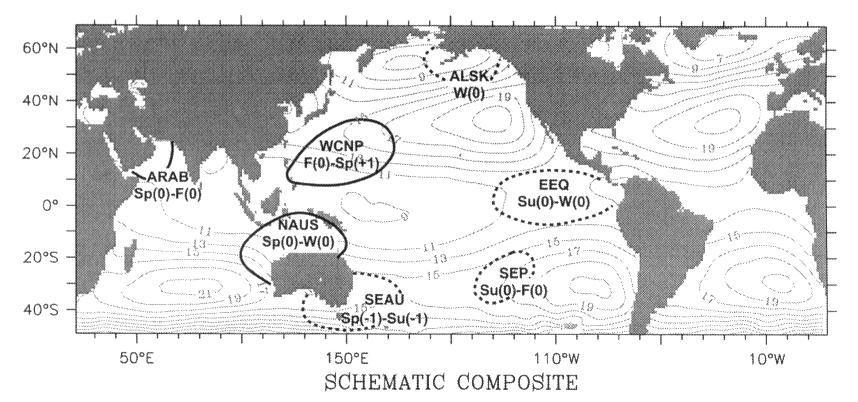
In our near-global (50°S to 70°N) SLPAN composite, ENSO has statistically significant expression in both hemispheres of the Indian and Pacific Oceans, but none in the Atlantic. The most significant composite signals are found in the northern central and eastern equatorial Pacific. Other less significant Pacific signals occur in the southeastern Pacific, off southern Australia, off northern Australia extending into the Maritime continent, and off the coast of Alaska. In the Indian Ocean, positive anomalies occur everywhere in the north, but are particularly significant in the Arabian Sea off the Arabian Peninsula. We present these features of the composite in section 4 and summarize them schematically in Fig. 7. The composite does not manifest basin scale propagation of the ENSO period signal, particularly during Year(0)-Year(+1). Highs and lows appear, intensify approximately in place, and then diminish. In particular, the Dateline between 15°N and 15°S has very small signals and can be viewed as a node during Year(0).
In order to compare our results with previous work, we review the sequence of the composite event, making reference to previous work as it pertains. May(-1) is the first month to yield a significant signal. It is found off Southeast Australia (SEAU) and continues through June-July(-1) before diminishing. This is the oceanic extension of an Australian SLPA low described by Kiladis and van Loon (1988). They found locally significant lows in land based pressure measurements for the period May-July(-1) and August-October(-1), diminishing in November(-1)-January(0). Our signal is also confined to an area west of the Dateline, as was theirs, but falls below significance by September(-1).
There are no significant signals found in our composite from September(-1) to March(0). Several positive anomalies occur in April(0), brokenly extending from just north of Australia north at about 25°S (NAUS) into the Indian Ocean and the Arabian Sea off the Arabian Peninsula (ARAB). These positive anomalies match with the "peak phase" Indian Ocean signals described by Cadet (1985). These anomalies are followed in May-June(0) by a negative anomaly centered in the eastern equatorial Pacific (EEQ), connected with another center in the southeastern Pacific (SEP). EEQ and SEP are the first extremely strong features of the composite, with SLPAN values below -1.6 in July-August(0). The SEP negative anomaly center disappears by October(0), during which time NAUS weakens. The EEQ anomaly remains strong into Year(+1). NAUS and SEP are the signature of the classical Southern Oscillation pressure swing that has been much studied (Trenberth and Shea, 1987; Kiladis and van Loon, 1988). EEQ is located within an area studied by Wallace et al. (1989) and is similar to a center of low SLP on equatorial SST regression values found by Deser and Wallace (1990).
In November(0), a positive anomaly ridge forms in the west-central north Pacific (WCNP). WCNP intensifies through January(+1), obtaining SLPAN values greater than 1.4 . During this time, a negative anomaly off the Alaskan coast (ALSK) appears for one season only. The EEQ, NAUS, and ALSK anomalies drop below significance by March(+1), leaving only the WCNP high to decay through April(+1). WCNP is similar to strong SLP negative correlation "teleconnectivity" centers found by Wallace and Gutzler (1981) both in SLP, corresponding to the North Pacific Oscillation, and in 500 mb height, corresponding to the related Western Pacific pattern. The opposing centers for both patterns are located near the Dateline but are too far north (>66°N) to be visible in our data. These patterns are distinct from the Pacific/ North American (PNA) pattern whose centers are too far east to match directly either WCNP or ALSK. Wang (1995) also finds a maximum positive SLP signal in March(+1) in a region that encompasses our WCNP region but is much larger. Our composite differs from Wang's analysis in other ways, in that he finds another maximum SLP anomaly to the east of Australia in May(+1) that we do not see, and he does not find any significant SLP signal in our EEQ region. These results are also consistent with van Loon and Labitze (1987) who found in entire western Pacific in the northern Henisphere to be significantly high on average during El Nińo periods.
In addition to satisfying a local 95% confidence criteria, we tested each feature of the composite for field significance as per Livezey and Chen (1983) (section 4.1). Only the EEQ and WCNP signals satisfy this stringent field significance test at the 95% level.
To assess the robustness of the features of our composite, we examined time series of the full 1946-1993 record in the vicinity of each feature (section 5). Some aspects occur in the SLP record every time there is an ENSO event, and only when there is an ENSO event. Other aspects do not have such a tight relationship with ENSO, but most aspects occur in the majority of ENSO events. Typically we do not find composite-type behavior during non-ENSO periods. The larger and more intense the signal in the composite, the more robust the signal tends to be. Thus we believe that the composite perspective does offer a useful framework in which to think about the evolution of ENSO events.
We find the EEQ signal to be extremely robust and the WCNP signal to be only slightly less so. Within the NAUS region, there is a positive anomaly in each event, but the location and timing are not consistent from event to event. The SEP negative feature is typically present somewhere in this region of the ocean, but also shows considerable event to event variability. ARAB SLPA typically is significantly positive during ENSO events but is also high during many non-ENSO periods. The SEAU and ALSK features result primarily from large signals in a few events.
Except for the SEAU signal in Year(-1) and the ALSK signal in late(0)-early(+1), the schematic composite features do typify the behavior of SLPA during ENSO. While only the EEQ signal during Year(0) is uniquely associated with ENSO periods (section 5), the other features (except ARAB) occur only infrequently during non-ENSO periods.
The EEQ signal deserves special attention as it is unique to ENSO periods. We find EEQ to be better correlated with central equatorial Pacific SST than any other sea level pressure signal, including the Troup SOI. Wallace et al. (1989), in discussing SST, SLP, and wind connections in the eastern equatorial Pacific, also noted the high negative correlation between SLPA and El Nińo South American coastal SST anomalies for a larger region containing EEQ. Their larger area average, however, does not have a unique "if and only if" relationship to ENSO periods. Our analysis also finds that SLPAN values less than -1 in EEQ are a better index for the existence of an ENSO event and the end of an event than are negative values of the SOI. We also suggest that EEQ SLPAN can serve as a useful index for the intensity of ENSO events; 1982 had negative EEQ SLPAN in excess of -2, while other major events typically have maximum values in excess of -1.5; lesser events only just exceed -1. In a companion paper (Harrison and Larkin, 1996), we report a variety of connections between SLPA, SST anomalies, and surface winds associated with ENSO periods and discuss the further issues of classifying ENSO periods and determining the intensity of ENSO events.
Although there are only ten ENSO events between 1946 and 1993, the time series plots (Figs. 9-14) suggest that some of the composite characteristics of ENSO have changed over this period of time. In particular, no event since 1972 has shown a clear, strong, precursive SEAU low, a feature common in the pre-1976 ENSOs. The 1982 ENSO had by far the most substantial signal over EEQ and ALSK of any event in the record. Also in the 1982 and 1991 events, more signal persists into Year(+1) than in other events. Although the composite shows no Atlantic signal, several of the post-1972 events have had substantial equatorial Atlantic expression, but these have not been strong enough to over-balance the opposite behavior found in other events (see Larkin and Harrison, 1996, for time series in this region). It is important to note that none of these aspects can be accorded any statistical significance on the basis of this data set. The statistical stationarity of the major features of ENSO deserves further study, data permitting.
A surprising aspect of the composite is the extent to which the most robust aspects of the composite SLPAN ENSO life-cycle occur near the equator and in the northern hemisphere. The northern hemisphere expression of ENSO is both more intense, relative to its total variability, and more consistent from ENSO to ENSO event than is the southern hemisphere signal. Other work has also suggested that the northern hemisphere SLP ENSO signal is greater than the southern hemisphere (e.g., Barnett, 1985). However, our composite results differ from Barnett's empirical orthogonal function analysis results in several respects. We find no evidence for eastward propagation of the signal across the Pacific (a prominent feature of his analysis), and our maximum northern Pacific signal is in a different location. Our eastern equatorial Pacific signal is much more significant than suggested by Barnett.
The southern hemisphere SLPA anomalies during ENSO periods have previously received considerable attention, due to the availability of island SLP data. Historically, descriptions have focused on large scale pressure swings between the western Pacific near Australia and the eastern Pacific near Tahiti that have been correlated with El Nińo events (e.g., Rasmusson and Carpenter, 1982). This Southern Oscillation aspect of the SLPA signal deserves discussion. The Southern Oscillation's east-west negative swing is included in the composite through the rise in SLP in the NAUS region and the decrease of SLP in SEP. The details of these features, however, appear different from previous studies, notably Trenberth and Shea (1987). In particular, we see confinement of the southern-hemisphere negative signals to EEQ and SEP, and we do not pick out this pressure swing as the dominant SLPA feature of ENSO periods. Such comparison is complicated somewhat by the fact that previous works have examined this variability with different time filters.
Trenberth and Shea (1987) define the Southern Oscillation to involve SLPA patterns on time scales long compared to those being examined here. Their study of the patterns and evolution of the Southern Oscillation uses an 11-point low pass filter with a half-power period of 20 months, effectively filtering out all energy on periods shorter than one year. They chose this long time filtering in order to seek smoothly time varying basin scale patterns for coherence analysis. None of the features in our composite last for more than a year, and most last for only three seasons. Thus Trenberth and Shea confined their interest to phenomena different from those identified by our compositing strategy. The very large spatial scale patterns identified in their study of the Southern Oscillation have counterparts in the basin scale background patterns of our composite. We have redone our composite analysis, using the RC space smoothing used here, but with the time-filter used by Trenberth and Shea (defined in Trenberth, 1984) instead of the RC three month running mean. When results are presented in SLPAN, again at the 99% confidence interval and above, but appropriately adjusted for the change in standard deviations (Larkin and Harrison, 1996), we find that the EEQ and WCNP signals remain robust and are still the most intense signals, while the NAUS signal is more spatially coherent and the ALSK signal disappears. ARAB remains virtually unchanged. The biggest change is seen in the SEAU signal, which shows increased persistence and expands to the southwest, now matching up with an SLPA low found by van Loon and Shea (1987) during this same period. At the end of Year(-1) and in early Year(0), SEAU, under the Trenberth and Shea filter, extends eastward, seeming to link the SEAU Year(-1) signal with the SEP Year(0) signal, as was found by van Loon and Shea (1987). This transition signal does not meet our field significance criteria, however.
The other time filtering method is typified by Deser and Wallace (1987) who define the Southern Oscillation to be "the seesaw in surface pressure anomalies between the Indian Ocean-Australian region and the southeastern tropical Pacific on seasonal time scales" (p. 14,189) and only smooth with seasonal filters. Relative to this usage, it is appropriate to speak of the composite SLP patterns we identify as the "evolution" of the southern oscillation during the 1946-1993 ENSO periods. This usage is not consistent with that used in Trenberth and Shea (1987), however. Our re-analysis, using the Trenberth and Shea filter, shows that the details of the composite are altered when greater time smoothing is introduced, but that the WCNP and EEQ signals remain dominant. However one describes them, there are substantial SLP signals that form and decay during ENSO periods in each hemisphere. Any dynamic model of the ocean-atmosphere interaction during an ENSO event needs to account for the more localized northern signals and their higher frequency components as well as the smaller, broader scale and lower frequency signals of Trenberth and Shea's study.
There has been considerable speculation about the nature of the connections between ENSO and the seasonal march in recent years. Philander (1990, chapter 6) and others have remarked upon similarities between the seasonal march and aspects of the RC SST composite, and there has been speculation that perhaps the initial phases of ENSO can be viewed as an enhancement of the seasonal march. Comparison of our composite with the climatological seasonal march over the same period (see appendix) shows no substantial similarity either in the patterns or progression throughout the year. Aspects of our composite do occur during the same period in all of the individual events in our record. Thus there is a strong connection (phase locking) between the seasonal cycle and our ENSO variability, but the variability does not resemble the evolution of the seasonal march. Overall, the ENSO patterns of variation appear so unlike the patterns of the seasonal march as to suggest that the phenomena responsible for ENSO are distinct from those responsible for the seasonal march. Recent work (e.g., Wang, 1995) has speculated how two phenomena as dissimilar as the seasonal cycle and ENSO seem to be, could be "phase locked." The relationship (or lack thereof) between ENSO processes and the seasonal march deserves further study.
The composite view of ENSO cannot convey the many interesting details of individual ENSO events, but we believe that it describes sufficient commonality to be useful. Several aspects of the composite merit further study. In particular, what are the atmospheric or coupled ocean-atmosphere processes that lead to the shift from a southern-hemisphere/ equatorial pattern in mid YR(0) to an eastern equatorial/ western north Pacific pattern in early Year(+1)? Why is the Dateline nearly a node for ENSO atmospheric mass redistribution, and how are the various other aspects of this redistribution brought about? How do we rationalize the seeming absence of phase propagation of SLPA signal with the present coupled oscillator models of ENSO?
We believe that this composite perspective, and its robustness, provides a useful tool for identifying significant ENSO period signals. We hope that it can help provide a framework to focus thinking about basic coupled ocean-atmosphere processes and interannual variability, and will be pleased if this paper, and its companion on SST and surface wind (Harrison and Larkin, 1996), provides a fraction of the stimulation offered by Rasmusson and Carpenter (1982).
Acknowledgements. This work was done as part of the Thermal Modeling and Analysis Project (TMAP) at PMEL. TMAP research is supported through funding: to the NOAA/UW Hayes Center for the Study of Seasonal to Interannual Variability by NOAA's Office of Global Programs and ERL headquarters; by the NASA Mission to Planet Earth Physical Oceanography Program (NASA Interagency Agreement #W-18,242); and through funding from Dr. Eddie Bernard, Director, PMEL. Mr. Larkin is supported through an NDSEG fellowship. We thank Grant Beard from the Bureau of Meteorology, Australia, for the Tahiti SLP, Darwin SLP, and Troup SOI monthly data, and NOAA CDC for maintaining the COADS data. This work was analyzed using the FERRET data visualization program, created and freely distributed by Steve Hankin of TMAP (http://www.pmel.noaa.gov/ferret/home.html). Jerry Davison and Kevin O'Brien, TMAP staff, assisted in many ways. Finally, Ed Sarachik, Mike Wallace, Gene Rasmusson, and George Philander deserve special mention for years of stimulating discussion about El Nińo, the Southern Oscillation, and other phenomena of tropical ocean/atmosphere interaction. This is PMEL Contribution Number 1647 and NOAA/ Hayes Center publication Number 359.
Return to previous section or go to next section