U.S. Dept. of Commerce / NOAA / OAR / PMEL / Publications
Appendix
The Annual Mean and Climatological Seasonal March
A brief review of the global SLP field and its seasonal march is given here as a reference for discussion of the ENSO signals. Although many of these results are known to meteorologists, they are less so to oceanographers, and we offer a somewhat different presentation of the climatological march than we have seen elsewhere.
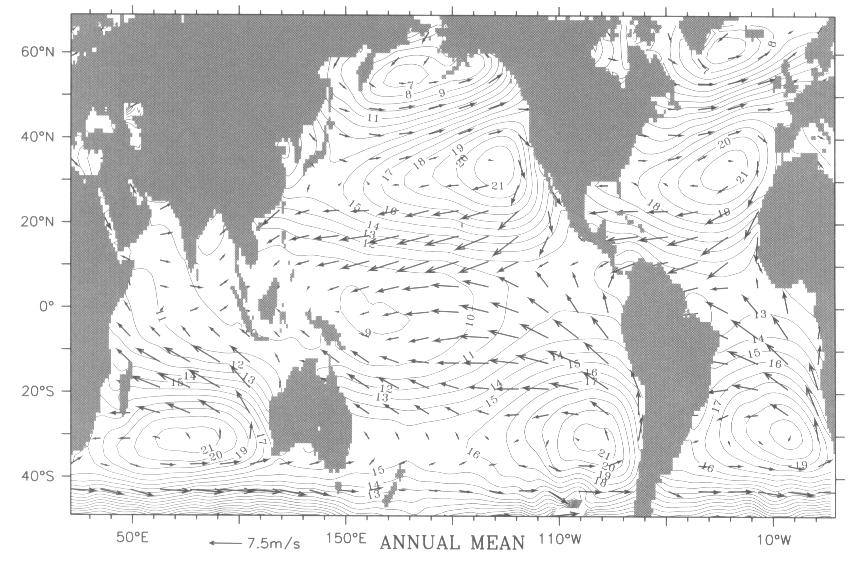
Figure A.1 presents the RC-smoothed (see section 2 for definition) annual mean SLP and surface wind fields. Although our focus here is on SLP and its variability, because the wind tends to flow down-gradient near the equator and roughly along isobars further poleward, including the wind field may help the reader to visualize the impact of SLP variations. The major SLP features are familiar: subtropical highs in each ocean in each hemisphere with maxima (of about 1020 mb) near 32° latitude and subpolar lows in the North Atlantic and Pacific with minima (of about 1006 mb) near 60° and 55°N, respectively. There is also a second subtropical maximum (of about 1019 mb) in the northern hemisphere just at the Asian coast near 38°N. The southern hemisphere poleward of its subtropical maxima has diminishing SLP values down to 50°S, which is as far south as we feel it is defensible to present COADS SLP results.
Fig. A1. The annual average SLP and wind fields, RC smoothed. SLP is shown as (SLP - 1000) mb with a contour interval of 1 mb. The annual average wind field is superimposed (scale as indicated).
The tropical patterns differ considerably from ocean to ocean. The Pacific has an equatorial minimum near 160°E, with SLP increasing eastward to about 110°W (about 3 mb total increase) followed by a slight decrease to the South American coast (80°W), and increasing westward all the way across the Indian ocean to the African coast (about 3 mb total increase) from the minimum. The equatorial Atlantic has very little SLP gradient, being everywhere between 1012 and 1013 mb, but with the highest value near its center.
Two other features of the mean merit note. The northern hemisphere Indian ocean is unique, in that it has little meridional SLP gradient; thus it lacks the northeasterly trades present in the Atlantic and Pacific. The northeasterly trades are present in the Indian Ocean during the winter months, but are cancelled out by the southwest monson in the annual mean. The zonal extent of the subtropical highs is about 100° of longitude in every basin, which leaves the western South Pacific with a weak saddle along 35°S between 160°E and 150°W.
The seasonal march is presented as monthly mean departures from the annual mean in Figs. A.2.a-f. There is considerable structure to the seasonal march, so we do not attempt to represent it simply by the amplitude and phase of the annual harmonic. Despite the length of the following description, we believe it useful to look at the seasonal march in some detail, particularly because there is still much uncertainty about the extent to which ENSO can be thought of usefully as an enhancement or modification of the seasonal march. The surface wind seasonal march departures are overlaid, as for the mean.
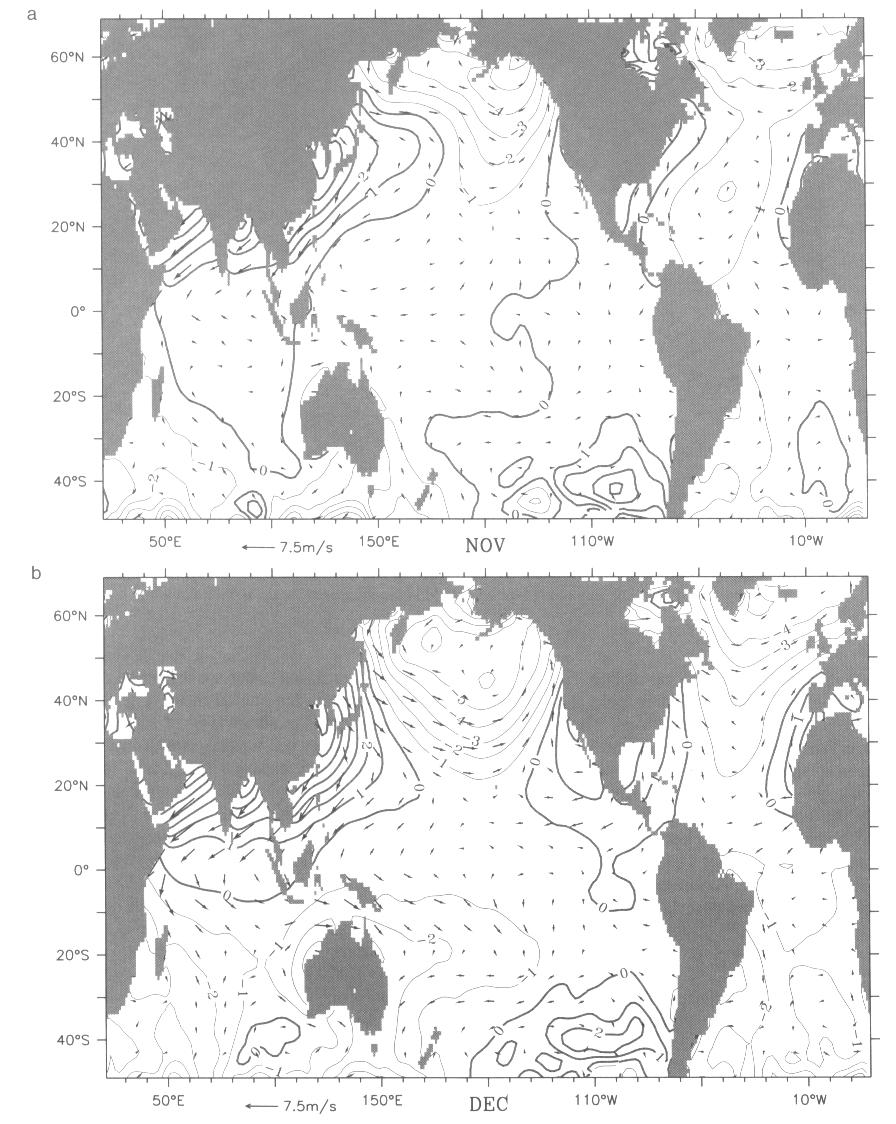
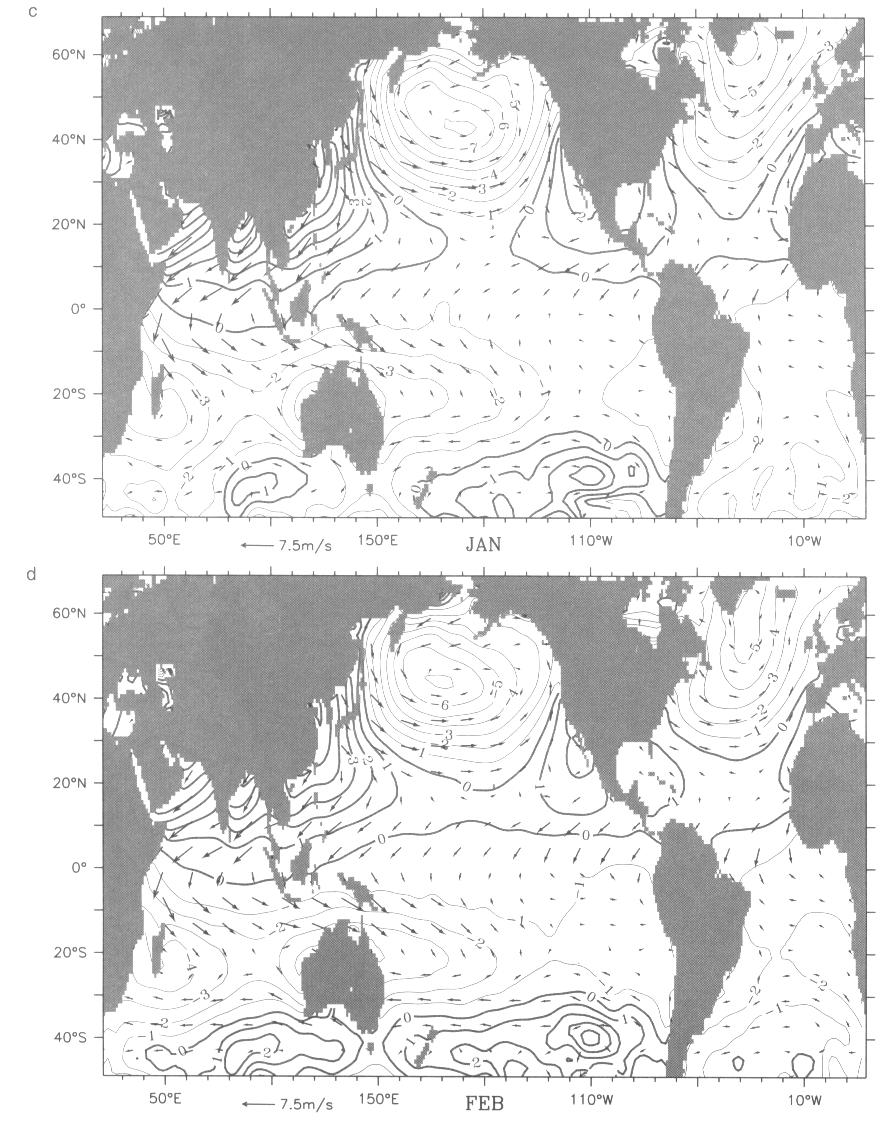
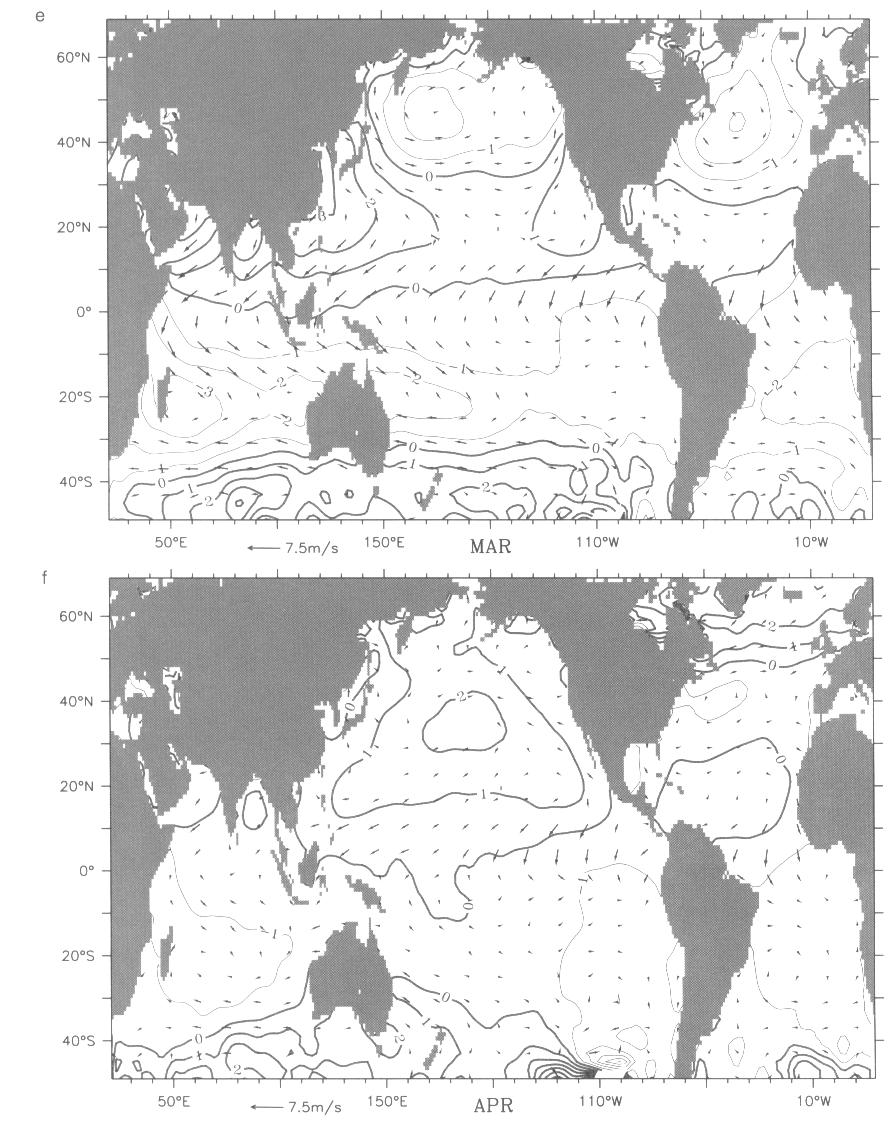
Fig. A2. The SLP and wind monthly climatology departure from their annual means, RC smoothed. The SLP departure in mb, positive (heavy line) and negative (light line). The wind departure with scale as indicated.
We begin with November, the month which is most similar to the annual mean (Fig. A.2.a). The largest departures are in the Pacific. There is an Asian high, 6 mb higher than the mean near the coast, diminishing to zero about the Dateline. From about 30°N to the equator, predominantly NNE wind departures are associated with this feature. The northern Indian Ocean is also positive, with largely NE wind departures. The North Pacific north of about 40°N is anomalously low (-6 mb in the Gulf of Alaska), resulting in westerly wind departures. The Atlantic is within 2 mb of the annual mean between 40°S and 60°N.
In December the Asian and Indian positive departures increase, and the North Atlantic and North Pacific negative departures deepen and extend further toward the tropics. Positive departures form around the US and Central America, but do not extend as far as the equator. The entire South Indian, and almost all of the South Pacific, show negative departures with the maximum values near Australia. The South Atlantic continues to have very weak departures except near the Argentine coast.
In January and February the December pattern has intensified. The biggest changes are tropical negative departures between the equator and 20°S from the east African coast to about the Dateline, with substantial northwesterly winds. The northern hemisphere negative departures are at their most intense (-10 mb at 40°N, 160°W; -7 mb just SE of Greenland). In February, positive departures and easterly wind anomalies appear south of 35°S in the Indian and Pacific basins.
In March there is a major pattern shift to a zonally banded structure for the SLP departures: negative north of about 35°N; positive between about 25° and 5°N; negative south of 5°N to about 35°S and then positive further south. The North Pacific low is greatly reduced in strength. There continues to be a positive extremum at the Chinese coast which diminishes eastward. For the first time in the seasonal march, the strongest wind anomalies are tropical and are found in all three basins.
There is an abrupt change in many of the departure patterns in April, and generally the departures are weaker than previously in both hemispheres. The Indian Ocean has little signal north of about 30°S, the South Pacific has little signal and the North Pacific now has positive anomalies everywhere with a high centered near (40°N, 180°). The North Atlantic anomaly is now positive north of about 40°N and the remainder of the Atlantic has small SLP anomalies. As in March, the largest wind anomalies are tropical. But now they are entirely associated with the Intertropical Convergence Zones of the Atlantic and Pacific.
Were the seasonal march to be completely symmetric, the anomalies of the remaining 6 months would simply be the opposite of November through April. It will suffice to complete this description of the seasonal march by pointing out the differences from this inverse pattern.
In May these differences include a zonal band of positive departure north of 50°N in the Atlantic (6 mb max vs -3 mb max) and a coherent SE Pacific negative departure south of 20°S and east of about 150°W. In June the departures are primarily south of 30°S in the South Pacific and the the SE Indian (about -6 mb vs 2 mb maxima). In July they are in the Atlantic between the equator and about 20°N (positive, about 2 mb max in both July and Jan.) In August the North Atlantic pattern is similar but weaker (3 mb vs -6 mb). In September the North Atlantic stays negative north of about 55°N, instead of becoming positive, and the Southern hemisphere south of 30°S is less consistently negative than would be implied from March; this may well be just a lack of data at the end of Austral winter. October has a three cell pattern in the North Pacific instead of a single cell in April; the largest changes are that there continues to be high pressure in the NW Pacific (still 4 mb maximum) and a minimum in and south of the Gulf of Alaska.
Return to previous section or go to next section