Cloud forcing at the surface, CFR![]() , is defined here as the difference between the observed downwelling radiation R
, is defined here as the difference between the observed downwelling radiation R![]()
![]() and the downwelling radiation at the surface expected under clear skies (skies with no clouds), R
and the downwelling radiation at the surface expected under clear skies (skies with no clouds), R![]() :
:
![]()
where the subscript x refers to either the l longwave or s shortwave components. In this section, we describe data sources for surface solar and longwave cloud forcing evaluated from moored buoys, and cloud forcing and total cloud amount fields from ERA-40, NCEP2, and ISCCP. Likewise, we describe the precipitation fields from ERA-40, NCEP2, and the Tropical Rainfall Measuring Mission (TRMM) that are used to identify precipitating and nonprecipitating periods.
a. EPIC data
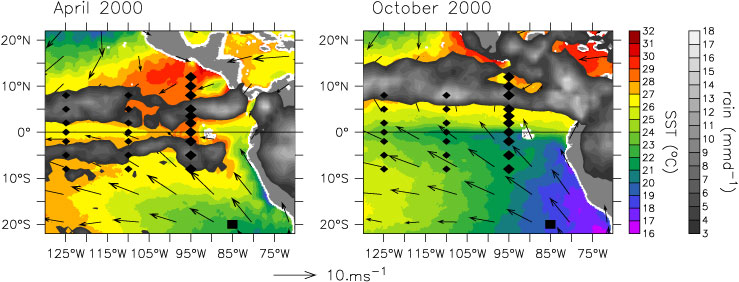
EPIC moorings used in this analysis include the enhanced Tropical Atmosphere Ocean (TAO) moorings along 95°W (at 8°S, 5°S, 2°S, 0°, 2°N, 3.5°N, 5°N, 8°N, 10°N, 12°N) and the Woods Hole Improved Meteorology (IMET) mooring in the stratus deck region at 20°S, 85°W (Fig. 1). Both mooring types have similar suites of surface instrumentation (Hosom et al. 1995; McPhaden et al. 1998; Payne et al. 2002; Cronin et al. 2002) including solar and longwave radiation (the primary variables in this analysis), wind speed and direction, air temperature, relative humidity, barometric pressure, rain rate, and sea surface temperature.
Both TAO and IMET systems used Eppley Laboratories, Inc., Precision Spectral Pyranometers (PSPs) to monitor downwelling shortwave radiation and the Precision Infrared Radiometers (PIRs) to monitor downwelling longwave radiation. Although the IMET and TAO systems each had slightly different mounting, electronic designs, and calibration procedures (Payne et al. 2002), both PIR systems computed downwelling longwave radiation from thermopile voltage, dome temperature, and casing temperature measurements (Fairall et al. 1998). TAO radiometers sampled at 1 Hz from which 2-min averages were computed. IMET radiometers sampled at 5-s intervals from which 1-min averages were computed. Both sets of PSP and PIR radiometers have root-mean-square errors less than approximately 10 W m![]() based upon manufacture specification, analyses of pre- and postcalibrations, and ship-buoy and shore-based side-by-side comparisons (Payne and Anderson 1999; Payne et al. 2002). For the PIR, the largest sources of error were calibration drift and temperature gradients in the casing. For the PSP, the largest sources of error were calibration uncertainties and mean and time-varying tilts in the mast. Owing to fishing-related vandalism, several 95°W TAO moorings were recovered with bent radiometer masts. Tilted masts can produce relatively large error in the daily averaged solar radiation magnitude on clear days when the angle is directed in the meridional plane (Katsaros and DeVault 1986; Medovaya et al. 2002). TAO buoys, however, are expected to vary in their orientation, and thus monthly averaging will tend to reduce errors caused by a bent mast. Records with a sudden drop in magnitude that were recovered damaged or were not recovered are not included in the analysis.
based upon manufacture specification, analyses of pre- and postcalibrations, and ship-buoy and shore-based side-by-side comparisons (Payne and Anderson 1999; Payne et al. 2002). For the PIR, the largest sources of error were calibration drift and temperature gradients in the casing. For the PSP, the largest sources of error were calibration uncertainties and mean and time-varying tilts in the mast. Owing to fishing-related vandalism, several 95°W TAO moorings were recovered with bent radiometer masts. Tilted masts can produce relatively large error in the daily averaged solar radiation magnitude on clear days when the angle is directed in the meridional plane (Katsaros and DeVault 1986; Medovaya et al. 2002). TAO buoys, however, are expected to vary in their orientation, and thus monthly averaging will tend to reduce errors caused by a bent mast. Records with a sudden drop in magnitude that were recovered damaged or were not recovered are not included in the analysis.
Hourly averages of surface IMET data and daily averages of all TAO data were telemetered to shore in near real time via Service Argos. High-resolution TAO data are available only after the mooring is recovered. Because the 95°W TAO moorings suffered substantial losses due to fishing-related vandalism, telemetered daily-averaged data are used when high-resolution data were not available. Use of daily-averaged data during these periods has minimal effect on the monthly averaged cloud forcing estimates.
The 20°S, 85°W site has been occupied by a Woods Hole Oceanography Institute IMET mooring since October 2000. A research ship visits the site each year around October to recover and redeploy a fresh system and perform at-sea comparisons within 0.5 km of the buoy. Solar radiometers were first deployed on the ten EPIC-enhanced TAO 95°W moorings in November 1999; longwave radiometers were deployed 6 months later in April 2000. Final recovery of the TAO EPIC enhancements was in November 2003 although, because of data losses, the analysis here ends in August 2003. TAO moorings were visited by a NOAA ship (either Ron Brown or Ka'imimoana) at 6-month intervals to perform repairs and necessary recoveries and deployments. These cruises were also opportunities for boundary layer measurements, which were used to help develop the clear-sky models (Hare et al. 2005).
To estimate surface cloud forcing, the expected clearsky radiation is subtracted from the observed "full sky" radiation (1). Expected clear-sky solar and longwave radiation estimates require a model. Following Hare et al. (2005), we use the Iqbal (1988) solar radiation clearsky model and the Hare et al. (2005) longwave clear-sky model with the buoy meteorological observations as input.
1) CLEAR-SKY SOLAR RADIATION
Clear-sky solar radiation at the top of the atmosphere can be determined based on solar constant (set as 1367 W m![]() (Lean 1997)) and calculations of the zenith angle. Between the top of the atmosphere and the surface, clear-sky solar radiation is reduced by transmission properties of the atmosphere, which Iqbal (1988) parameterizes in terms of integrated water vapor, aerosol optical thickness within different wavelength bands, and the ozone-layer optical thickness. Since we have only surface values, we further parameterize the integrated water vapor (IV) in terms of the surface specific humidity measurements (IV = bq
(Lean 1997)) and calculations of the zenith angle. Between the top of the atmosphere and the surface, clear-sky solar radiation is reduced by transmission properties of the atmosphere, which Iqbal (1988) parameterizes in terms of integrated water vapor, aerosol optical thickness within different wavelength bands, and the ozone-layer optical thickness. Since we have only surface values, we further parameterize the integrated water vapor (IV) in terms of the surface specific humidity measurements (IV = bq![]() ), where the seasonally and latitudinal varying scale value b is determined from the seasonal cycle of IV/q
), where the seasonally and latitudinal varying scale value b is determined from the seasonal cycle of IV/q![]() as estimated from ERA-40. For 95°W sites, biannually varying aerosol optical thicknesses are used (0.04 for bands 1 and 2 during the spring; 0.001 for bands 1 and 2 during the fall); while for the 20°S, 85°W site, mean aerosol optical thicknesses are used (0.03 for bands 1 and 2). At all 11 sites, a mean ozone optical thickness of 0.2 is used. For more detail, see Hare et al. (2005).
as estimated from ERA-40. For 95°W sites, biannually varying aerosol optical thicknesses are used (0.04 for bands 1 and 2 during the spring; 0.001 for bands 1 and 2 during the fall); while for the 20°S, 85°W site, mean aerosol optical thicknesses are used (0.03 for bands 1 and 2). At all 11 sites, a mean ozone optical thickness of 0.2 is used. For more detail, see Hare et al. (2005).
To remove any bias from the clear-sky estimates, the clear-sky model was compared to the high-resolution buoy radiation observations on very clear days. Following Medovaya et al. (2002), daytime values (when expected solar radiation was higher than 500 W m![]() ) were deemed clear if the magnitude of the observed solar radiation time rate of change never exceeded the expected slope by more than 50% and the observed solar radiation was never below 94% of the expected clear-sky value. At 8°S, 5°S, 2°N, and 3.5°N; 95°W these criteria were never met. In all, 58 days met the criteria, producing a mean bias of 6 W m
) were deemed clear if the magnitude of the observed solar radiation time rate of change never exceeded the expected slope by more than 50% and the observed solar radiation was never below 94% of the expected clear-sky value. At 8°S, 5°S, 2°N, and 3.5°N; 95°W these criteria were never met. In all, 58 days met the criteria, producing a mean bias of 6 W m![]() that was removed from the 95°W sites. For the stratus site at 20°S, 85°W an additional criterion that the longwave cloud forcing be less than 25 W m
that was removed from the 95°W sites. For the stratus site at 20°S, 85°W an additional criterion that the longwave cloud forcing be less than 25 W m![]() was applied. Based upon 5 days meeting the clear-sky criteria a mean bias of 5 W m
was applied. Based upon 5 days meeting the clear-sky criteria a mean bias of 5 W m![]() was removed from the 20°S, 85°W modeled solar clearsky time series. With the mean bias removed, the rootmean-square error in the solar clear-sky is estimated to be ±7 W m
was removed from the 20°S, 85°W modeled solar clearsky time series. With the mean bias removed, the rootmean-square error in the solar clear-sky is estimated to be ±7 W m![]() .
.
2) CLEAR-SKY LONGWAVE RADIATION
Clear-sky longwave [or far infrared (IR)] radiation can be modeled as
![]()
where T![]() is the air temperature in units kelvin,
is the air temperature in units kelvin, ![]() is the Stefan–Boltz constant, and
is the Stefan–Boltz constant, and ![]()
![]()
![]() is the effective emissivity for clear skies, parameterized in terms of the surface specific humidity q
is the effective emissivity for clear skies, parameterized in terms of the surface specific humidity q![]() , integrated water vapor IV, and latitude y according to Hare et al. (2005):
, integrated water vapor IV, and latitude y according to Hare et al. (2005):
![]()
where
![]()
The 3.5 W m![]() bias removed from the clear-sky computation in (2) accounts for the lower height of sensors on buoys relative to that on ships. As described in the previous subsection, integrated water vapor (IV) is estimated from specific humidity and a scale value from ERA-40. As with the solar clear-sky model, a bias in the modeled clear-sky longwave was computed and removed based upon the observed solar radiation criteria described above. In contrast to the solar clear-sky bias calculation where the criteria must be satisfied for the full day, partial days were acceptable for computing the longwave bias. In this way, a mean bias of 2 W m
bias removed from the clear-sky computation in (2) accounts for the lower height of sensors on buoys relative to that on ships. As described in the previous subsection, integrated water vapor (IV) is estimated from specific humidity and a scale value from ERA-40. As with the solar clear-sky model, a bias in the modeled clear-sky longwave was computed and removed based upon the observed solar radiation criteria described above. In contrast to the solar clear-sky bias calculation where the criteria must be satisfied for the full day, partial days were acceptable for computing the longwave bias. In this way, a mean bias of 2 W m![]() was removed from the 95°W longwave clear-sky estimates, and a mean bias of -5 W m
was removed from the 95°W longwave clear-sky estimates, and a mean bias of -5 W m![]() was removed from the 20°S, 85°W estimate. Based on the in situ comparison with radiation on clear days and the comparisons with shipboard measurements, the error in the model clearsky IR is estimated to be ±6 W m
was removed from the 20°S, 85°W estimate. Based on the in situ comparison with radiation on clear days and the comparisons with shipboard measurements, the error in the model clearsky IR is estimated to be ±6 W m![]() .
.
3) IMPLICATIONS FOR ACCURACY OF BUOY CLOUD FORCING ESTIMATES
Using radiometers, which have an error of slightly less than 10 W m![]() , and using the modeled clear-sky radiation, whose error is 7 W m
, and using the modeled clear-sky radiation, whose error is 7 W m![]() for solar and 6 W m
for solar and 6 W m![]() for longwave, results in expected uncertainties of 12–17 W m
for longwave, results in expected uncertainties of 12–17 W m![]() for solar cloud forcing and 11–15 W m
for solar cloud forcing and 11–15 W m![]() for longwave cloud forcing.
for longwave cloud forcing.
b. ISCCP
ISCCP downwelling surface shortwave and longwave cloud forcing monthly radiative flux data (FD) were also evaluated (Zhang et al. 1995; Rossow and Schiffer 1999). The fluxes are computed using an updated radiative transfer model from the Goddard Institute for Space Studies (GISS) GCM and a collection of physical cloud and surface properties based on ISCCP data, including daily atmospheric profiles of temperature and humidity NOAA Television Infrared Observation Satellites (TIROS) operational vertical sounder, daily ozone abundance (total ozone mapping spectrometer), and various climatologies. The parameters considered here include clear-sky and full-sky shortwave and longwave radiative fluxes at the surface and total cloud cover. ISCCP results are on a 3-h and 280-km-squared grid (equal-area map equivalent to 2.5° latitude-longitude at the equator) from which monthly averages are computed and downloaded. ISCCP data are available only through June 2001.
c. NCEP2 reanalysis
The NCEP–Department of Energy (DOE) Atmospheric Model Intercomparison Project II (AMIP-II) Reanalysis (NCEP2) is a follow-on to the NCEP–National Center for Atmospheric Research (NCAR) Reanalysis (NCEP1) project (Kanamitsu et al. 2002). NCEP2 uses an updated forecast model, updated data assimilation system, improved diagnostic outputs, and fixes for the known processing problems of NCEP1. NCEP2 monthly averaged fields are on an ~1.9° grid and extend through August 2003. Parameters considered here include the surface downwelling solar and longwave radiation fields, surface downwelling clearsky fields, precipitation, and total cloud cover. Cloud forcing is computed from (1).
d. ERA-40
ERA-40 is a follow-on to the 15-yr ERA (ERA-15) project (Simmons and Gibson 2000). ERA-40 uses a finer resolution of the planetary boundary layer and an improved variational data assimilation system with a refined numerical model and assimilates a wider range of satellite data. In particular, ERA-40 includes reanalysis of scatterometer winds, special sensor microwave imager (SSM/I) radiance, ozone products and high-resolution infrared spectrometer ozone channel radiance. Monthly averaged ERA-40 fields are on a 2.5° grid and extend through July 2002. Parameters considered here include the surface downwelling solar and longwave radiation fields, surface downwelling clearsky fields, stratiform and convective precipitation rates, and total cloud cover. Cloud forcing is computed from (1) and the net precipitation rate was computed as the sum of the stratiform and convective rain rates.
e. TRMM rainfall
Regions with precipitation have different cloud populations than those without and, hence, would be expected to also have different cloud forcing. To discriminate between these two situations we use monthly rain rates and their error estimates from the level-3 (3B-43) TRMM product. The 3B-43 algorithm uses TRMM and other sources, namely TRMM, geosynchronous IR, and rain gauges to produce the “best” precipitation estimate in the TRMM region. The monthly averaged rain rates and error estimates are on a 1° grid. In our analysis we identify significant rainfall as rain rates larger than the provided rms error estimate. Likewise, if the TRMM rain rate was less than the provided error estimate, then the month was deemed dry to within error estimate.
Return to previous section or go to next section