Work in progress: EPIC Enhanced Monitoring
Work in progress: EPIC Enhanced Monitoring
with Nick Bond (NOAA / JISAO), Chris Fairall (NOAA / ETL) and Bob Weller (WHOI)
EPIC2001 workshop poster
This webpage is no longer in use. Please see published results:
Cronin, M. F., N. A. Bond, C. W. Fairall, and R. A. Weller.
Surface cloud
forcing in the east Pacific stratus deck/cold tongue/ITCZ complex.
J. Climate, 19(3), 392-409, 2006.
The purpose of the overview paper(s) are to:
- Compare ship and buoy data. Are these apples and
oranges? (No). Are there biases in one platform? How to use both
data sets to best advantage?
- Generate a set of benchmark figures that can be used for
model development and validation.
- Describe the large-scale structure of the eastern tropical
Pacific stratus deck/ cold tongue /ITCZ complex, and set the context
for more detailed analyses with these data and EPIC2001 data.
Paper 1. Cloud forcing (aka cloud signatures).
- Where and when are the ITCZs in northern
hemisphere and southern hemisphere observed?
dv/dy convergence = ITCZ from wind soundings:
see double ITCZ in Spring 2000, single ITCZ on equator Spring 2001,
single ITCZ in sh in Spring 2002,...
Satellite rainfall & OLR show double ITCZ in Spring 2000 was across almost the whole basin.
- How does this relate to large-scale SST?
e.g. SST > 28C? Satellite TMI SST shows band of warm SST beneath
sh ITCZ.
- How is moisture in boundary layer organized with respect to ITCZ?
and year-to-year and seasonal variations in SST and ITCZ?
look at rel humidity vertical section in soundings,...
NICK & CHRIS PLEASE ELABORATE ON THIS... Nick says northerly winds
aloft carry moisture southward.
- When/where does it rain? -- rainfall from Satellite (Xie & Arkin CMAP2),
and rainfall time series.
Xie and Arkin is monthly averages. Can talk qualitatively
about seasonal variability, probably not worth overlaying time series.
- Is there a freshwater signature in the ocean?
Do simple 1-d calculation of dS/dt * dt = (E-P)S_0 / H * dt
to backout precipitation rate. (i.e. dS/dt * H / S_0 ~ E-P ).
This might be compared to satellite and averaged buoy measurements.
- What is cloud forcing magnitude at surface, structure and variability?
CHRIS, BOB, and NICK: Should we try to relate this to rainfall?
- Is the solar and longwave cloud forcing equal and opposite?
... in some regions?
... in which case clouds have no effect on the
surface radiation. A surprizing result to an oceanographer. The
heat balance on the ocean will be defered to the next paper. Here,
we just want to know if the clouds affect the ocean heat budget or not.
- QUESTION: DO WE DISCUSS PRESSURE GRADIENT VARIATIONS? AND RELATION
TO ITCZ?
Paper 2. Convective Processes (aka Heat Fluxes between ocean and atmosphere).
- Buoyancy flux can cause convection in both atmosphere and ocean
...since flux tends to warm atmosphere from below and cool ocean
from above.
Discuss radiative fluxes vs. turbulent heat fluxes;
moisture fluxes vs. heat fluxes.
- What is the regional structure of buoyancy flux?
E-P vs. net surface heat flux? incoming solar, net longwave,
latent and sensible heat fluxes? What is temporal variability?
- What is meridional and seasonal structure of mesoscale variability?
(Convection occurs on mesoscales).
- Fluxes from ships vs. buoys. Version 3.0?
- How do fluxes relate to stability (Ts-Ta)?
wind and large-scale SST fields?
Relation between fluxes and cloud forcing discussed
in Paper 1 (cloud forcing)? or here (convective processes)?
- How good are the NWP fluxes? (ECMWF and NCEP)
Mismatch indicates that NWP do not model convective
processes correctly?
- What is mismatch between fluxes and SST tendency rate?
Are these differences reasonable in comparison to expected 3-d
effects?
- What are order 1 relationships between heat fluxes and cloud formation?
- Compare lifting condensation level (~Tdew - Tair) to cloud base
height, using sounding data and surface (e.g. buoy) data. Will
match if clouds are locally formed through buoyancy fluxes.
Paper 1: Cloud Forcing. Story and figures...
|
The EPIC array shown in relation to the November 1999 averaged TMI SST and
QuickSCAT wind stress fields.
Watch for those Teuhantepec winds in the ship sections. This figure
will correspond to the Fall 1999 section.
|
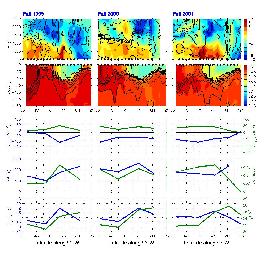
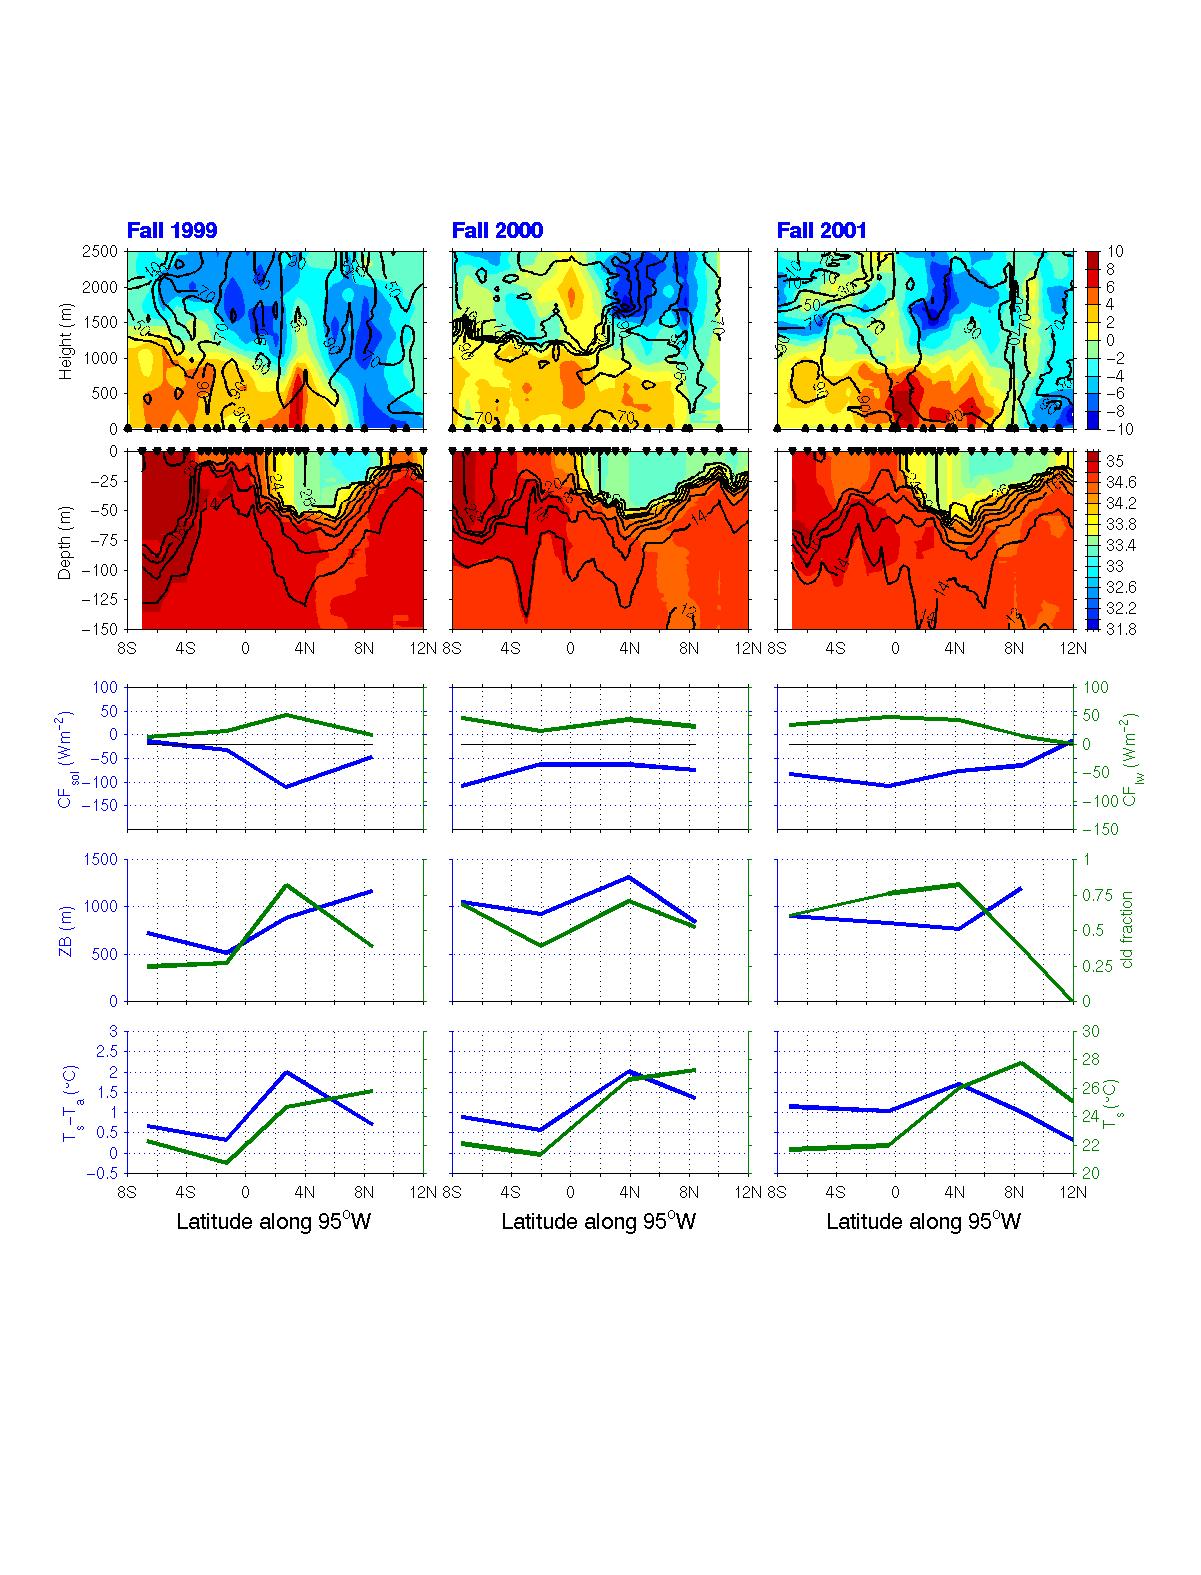
Fall ship sections. Top panel shows meridional winds (shaded) and relative humidity (contoured). 2nd panel shows salinity (shaded) and temperature (contoured). Bottom three panels show surface ship measurements
(solar and longwave cloud forcing, low cloud base height and cloud fraction,
air-sea temperature difference and SST).
- Compare to the original
EPIC cover document
- Strong northerly winds aloft in Fall99 bring moist air south across
equator.
- Compare Chris' ZB to the sounding data. Inversion height is ~cloud
top so cloud base is always below this. However, see the shoaling of
cloud base as go towards the equator and the very deep cloud base height
over ITCZ region.
- Also see high cloud fraction in regions of deep convection, and
zero cloud fraction where cloud forcing is zero (That's good!).
QUESTION: How do you like these sets of variables (bottom 3 panels) from
Chris? Thoughts? Are there other sets of
variables that would be more illuminating for this story?
CHRIS: I need daily-averaged data from you for this plot. These
data are from the latitudinally-averaged data.
|
|
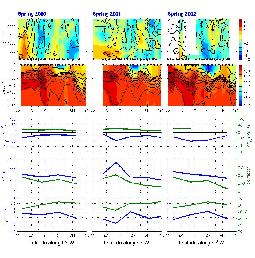
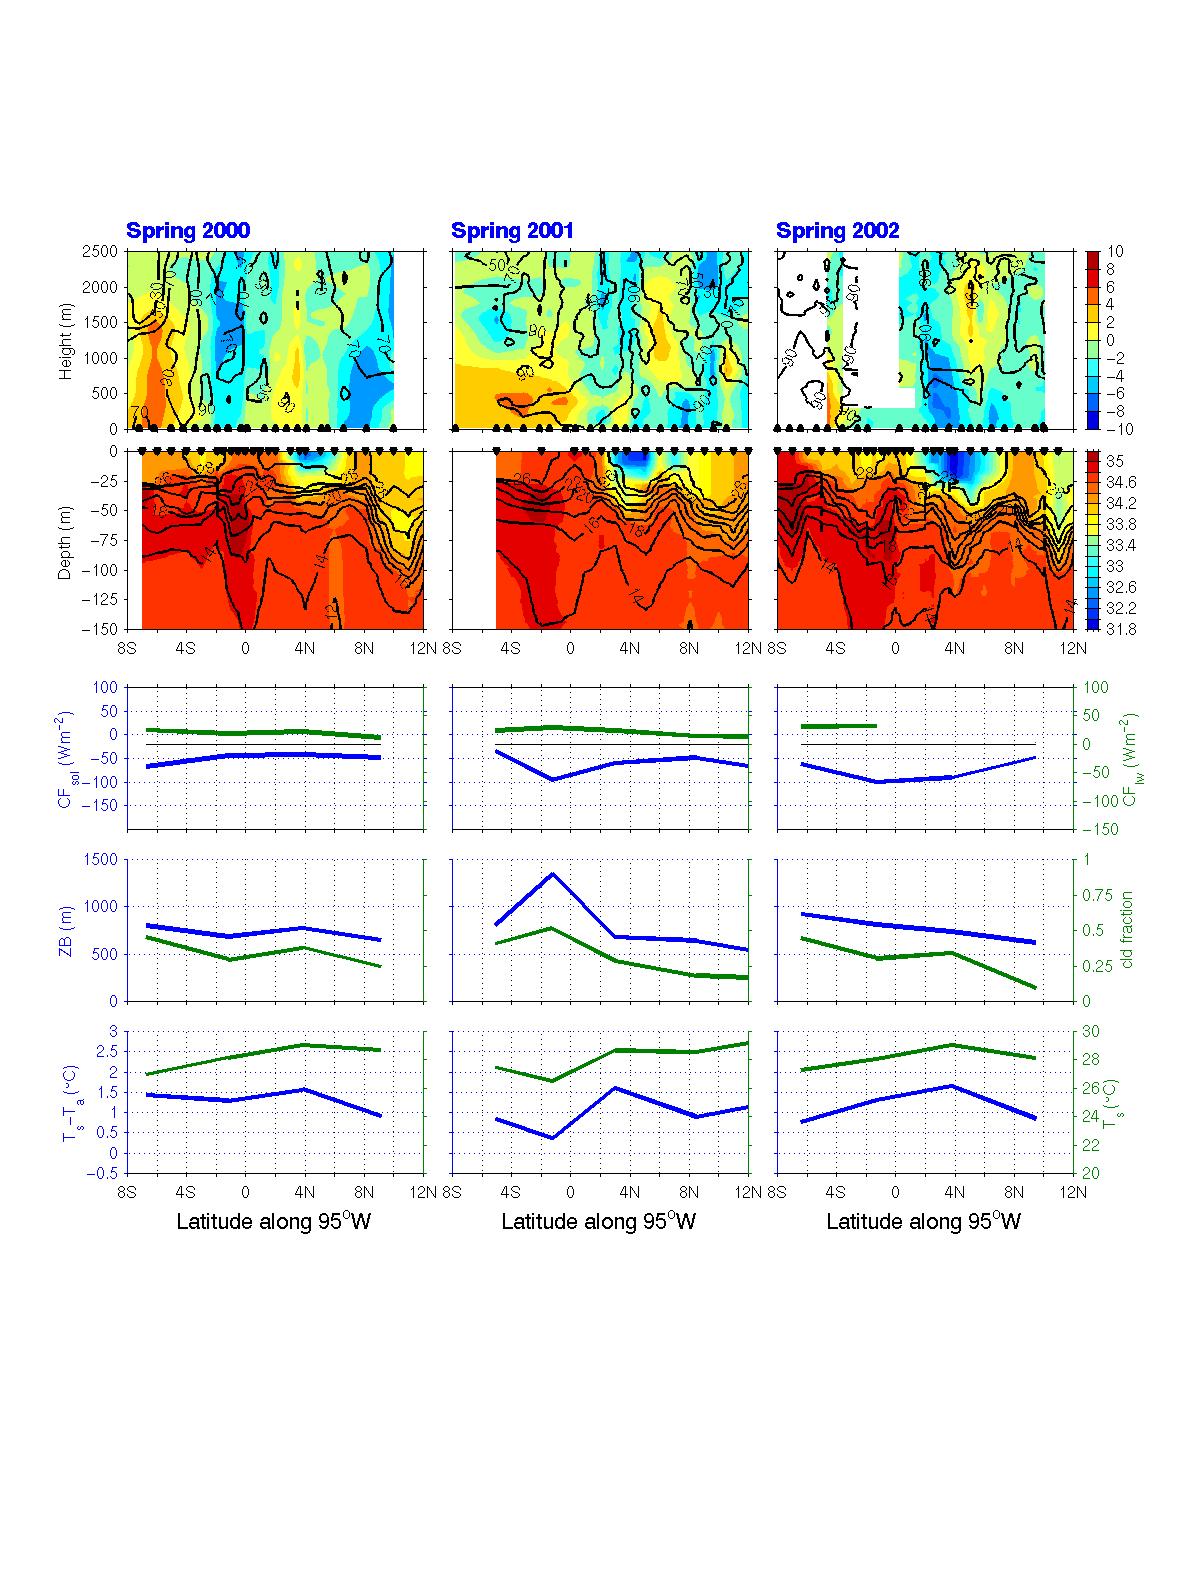
Spring ship sections
- Wow. Interesting ITCZ variability during Spring.
Spring 2000 = double ITCZ
Spring 2001 = Single ITCZ on equator
Spring 2002 = Single ITCZ in southern hemisphere
- ITCZs are associated with wind convergence and anomalous freshwater.
|
|
How prevalent is the southern hemisphere ITCZ during springtime?
Is the SH water warm enough (ie. warmer than 28C) to get deep convection?
For 1999 and 2000 (left fig) and 2001 and 2002 (right figure),
top panel shows regions where monthly averaged SST is greater than 28C,
bottom panel shows regions where monthly OLR is less than 240 W/m2.
The fields corresponding to March are filled. Feb, March, April, May and June
contours are overlaid. March and April seem to have the largest ITCZ in
southern hemisphere.
NOTE: I CAN REDO THIS WITH XIE-ARKIN MONTHLY RAINFALL INSTEAD OF
OLR.
Chris suggested using TRMM rainfall.
QUESTION: IS THERE A BETTER WAY TO PRESENT THIS? (Perhaps just show
Feb, Mar, and Apr). The point is that it is not a persistent feature.
Chris suggested making maps equivalent to the array base map (see
Fig. 1) with a corresponding rainfall map for Fall 99 and Spring 2000.
Can we see signatures of clouds and ITCZ variability in the surface buoy
data?
Solar radiation and SST along 95W.
- During Springtime, symettric structure in both SST and SWR.
Spring 2000 = double ITCZ
Spring 2001 = Single ITCZ on equator
Spring 2002 = Single ITCZ in southern hemisphere
- More reduction in SWR in northern hemisphere.
|
|
Solar and longwave Cloud Forcing Pixel timeseries.
Cloud Forcing = Observed Downwelling Radiation - Clearsky value.
CFRS (solar cf) is nearly always positive -- clouds reduce SWR.
CFRL (longwave cf) is nearly always negative -- clouds increase LWR.
- Largest CFRS (reduction in SWR due to clouds) in ITCZ.
- Cold tongue frontal region (equator to 5N) rarely had clearskies.
- Clouds have less effect on LWR in northern hemisphere than S.H..
- Do we believe these Negative CFRL? Do we believe very strong positive CFRL?
|
|
- Freshest waters are found during springtime ~ 3-5N.
- Saltiest waters at 8N-12N tend to occur in April-June.
- S.H. has freshening in springtime, with earlier freshening
occuring near equator and later springtime freshening at 8S.
|
|
These next 3 figures (below) show the time series from the stratus deck region
(leftmost), across the cold-tongue and frontal region (middle figure),
to the ITCZ and NEP Warm Pool region (rightmost figure).
Top panel: meridional winds -- shift to northerlies often indicate ITCZ.
second panel: solar cloud forcing in W/m2 -- Clear annual cycle seen in
north, but not as clear in south. (???)
middle panel: ir cloud forcing in W/m2, -- To me it almost looks
like ir cloud forcing is reduced (?) when raining. ??
next panel: rainrate in mm/day, -- Look at that rain in southern
region! Note, don't interpret no rain as zero rain!
bottom panel: SSS in psu. -- When it rains, it gets fresh. Particularly
in south.
QUESTION: IS THERE A WAY TO MAKE THE ABOVE PLOTS LESS COLORFUL FOR
PUBLICATION?
BOB: IF WE WANT TO INCLUDE DP/DY, PRECIP AND SSS IN THE STORY, I WILL NEED
THE CORRESPONDING IMET TIME SERIES.
The time series plots above show that the solar and longwave
cloud forcing are anti-correlating. Are they completely compensating
so that there is no cloud forcing felt on the ocean? Does the
relation between solar and longwave cloud forcing change as you
move from the stratus region northward to the convective region
of the ITCZ?
Scatter plot of solar cloud forcing (x-axis) vs. longwave cloud forcing (y-axis)
for each latitudinal band, using monthly averaged data.
The red circle is the corresponding annual mean ISCCP value.
Results:
Longwave cloud forcing is always less than solar cloud forcing.
Longwave cloud forcing tends to max-out at 50 W/m2 (slightly
higher in southern region, slightly lower in ITCZ region). However
solar cloud forcing can be more than -300 W/m2, nearly as large
as the daily averaged clearsky value. The relation between solar
and longwave radiation is not linear throughout the full range.
The straightline fits were computed only for solar cloud forcing values
under -150 W/m2 (cfrs > -150).
longwave radiation cloud forcing is larger in the south than
in the north. The latitudinal dependence comes from
- the latitudinal dependence in the ir clearsky formula,
- the bf = 3.5+2*(10-lat)/20 =q/IV for -10 the different moisture content with latitude and its effect
on irclearsky and solar clearsky (moisture air is warmer).
Different averaging will give you more or less scatter.

| |
I would like to include ECMWF values on the above scatterplot,
however, the solar radiation looks odd.
QUESTION: Should we develop a function for CFrl = function(CFrs,y)?
Chris says no need. But I think that it would be a nice product
from this paper. Nick says functional form is CFrl = function(CFrs,y,Ts) or
function(CFrs,y,Ts-Ta)... Also can show latitudinal variations in
range of solar cloud forcing.
Nick says do CFrs vs. CFrl for Spring vs. Fall (or Ts>28 vs.
Ts<28?). It might be that the slope at 2S and equator might be
more nearly 1:1 during the fall, when stratus is overhead and sky
is drier.
(Final) step... Relate the solar cloud forcing and/or net cloud
forcing to rainfall. ... Although as cloud thicken, rain is more
likely, but won't see change in cloud forcing necessarily. Perhaps
would be better to compare rainfall (which can be monitored
by buoys/satellite) to cloud top height or someother fancy
insitu boundary layer measurement from ship.
Paper 2: Convective Processes in the Eastern Tropical Pacific
(aka Heat Fluxes bet Ocean and Atm.). Story and figures...
Heat flux effects on buoyancy
in both atmosphere and ocean by warming atmosphere
from below leading to convection in atmosphere, and cooling
ocean from above, leading to convection in ocean...
Figure 1. Nick suggests showing sounding data: relative humidity (color) &
virtual potential temperature (contoured) and meridional winds
(vectors).
CF's panel 1) ZB vs. Lifting condensation level (soundings),
panel 2) Latent vs. Sensible heat fluxes;
panel 3) SST and Ts-Ta.
CTD panel: T & ADCP U.
The next 3 figures (below) show the measured variables that enter into
the heat flux calculation.
Top panel: Wind Speed -- There are low-wind regimes we have to be
careful about. (warm season in CT/frontal, warm season ITCZ).
CHRIS: our winds
don't seem to match at 12N95W in March 2001. Thoughts? Could this be
an averaging problem? Perhaps you are averaging in some gap winds to the
north of 12N? Looking at the QSCAT map, this is a region with large
d/dy in winds.
second panel: Incoming Solar Radiation & clearsky solar in W/m2
-- Don't want SWR to exceed clearsky too often. That is sign of instrumental
problem. Looks good.
middle panel: Incoming Longwave Radiation & clearsky IR in W/m2
next panel: Sea minus Air Temperature in C, -- This is a measure of
the boundary layer stratification/stability. Note, ship & buoy temperatures
are at different heights & depths.
QUESTION: Cold Tongue & Frontal regions often have
STABLE stratification for long periods. Do we believe that?
bottom panel: SST in C. -- ship sections got the peaks in warm & cold
season. That's fortunate!
Note: what if Ts-Ta panel was replaced by Qlat
and Ts panel was replaced by Qsensible ???
Next set of figures would show:
Monthly Qsol from buoys, NCEP, ECMWF, ??? and ship dots
Monthly Net LWR from buoys, NCEP, ECMWF ... and ship dots
Monthly ??? Qlat from highres buoys, NCEP, ECMWF, and ship dots
Monthly Qsen
SST?
How much heat content is dumped into/removed from upper ocean through
surface heat fluxes?
How good are the NWP's heat fluxes? Do we expect them to be able
to produce realistic SST?
Perhaps bring in Sounding Zonal Winds & ADCP Zonal Currents to show
where we might expect non-local processes in ocean heat budget? Or
perhaps this is another story...
|
Spring ship sections
- Wow. Interesting ITCZ variability during Spring.
Spring 2000 = double ITCZ
Spring 2001 = Single ITCZ on equator
Spring 2002 = Single ITCZ in southern hemisphere
- ITCZs are associated with wind convergence and anomalous freshwater.
|
|


