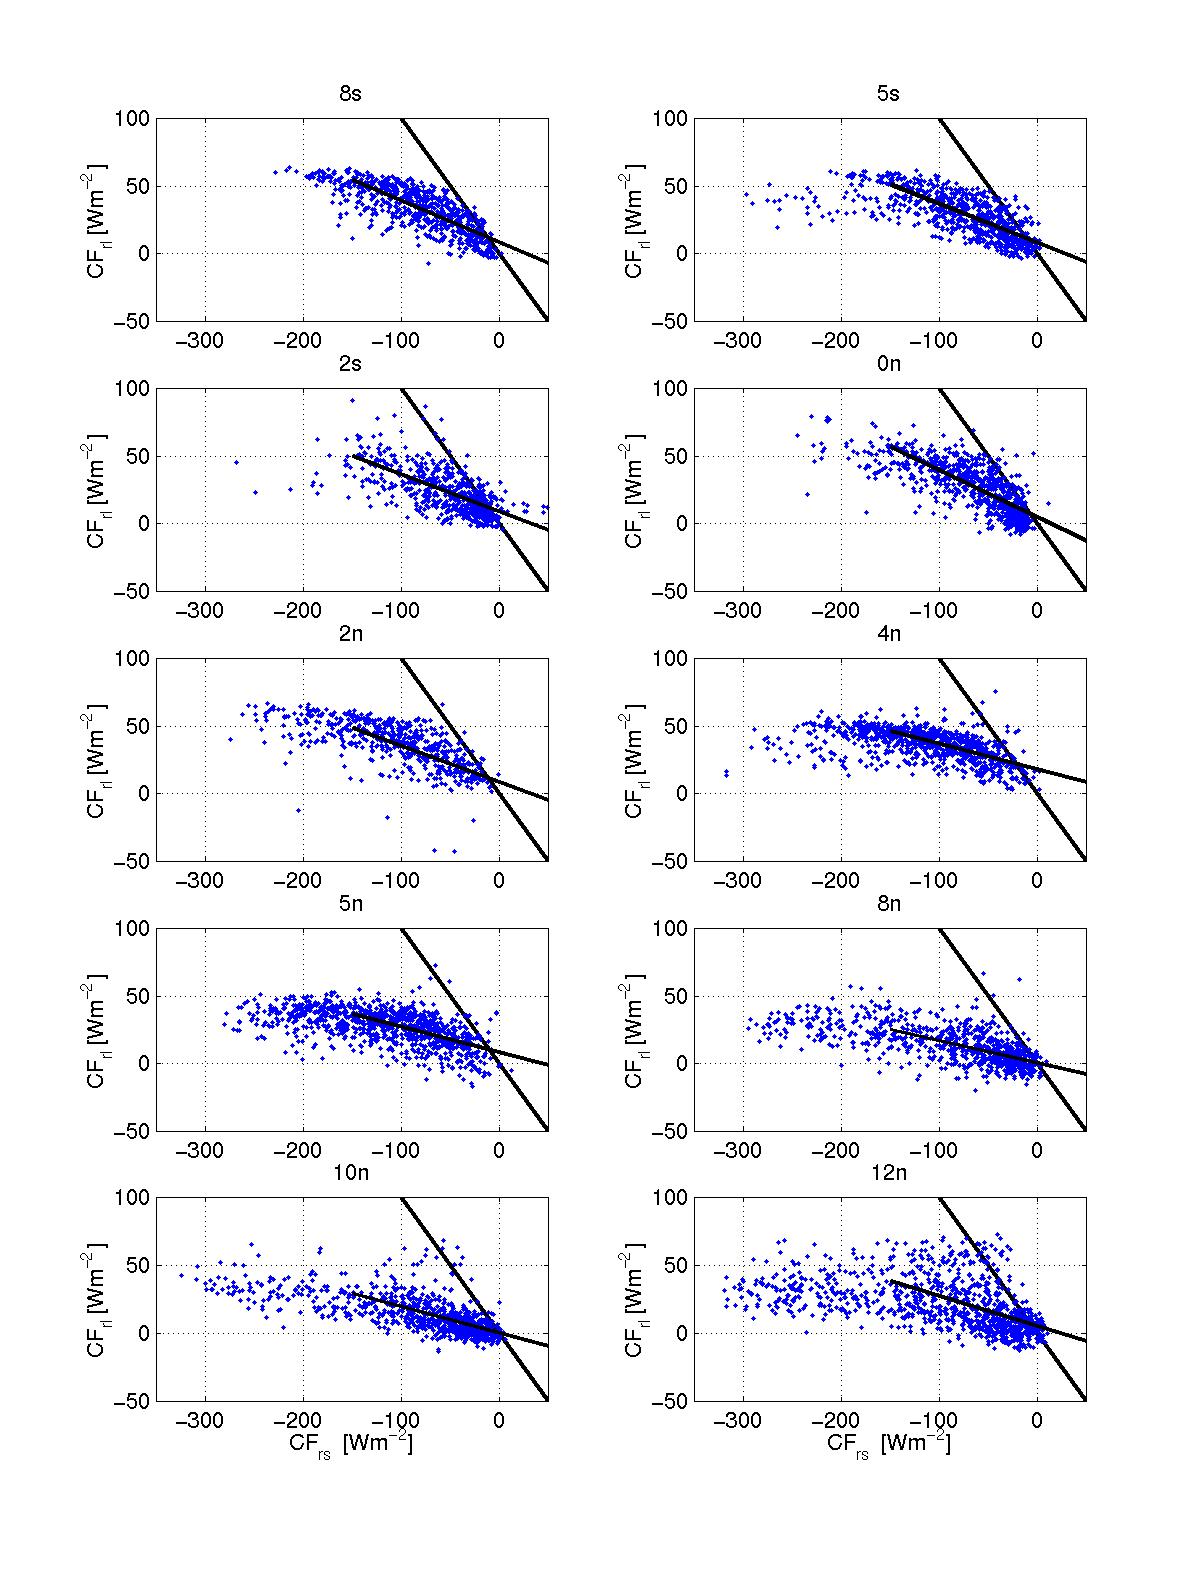
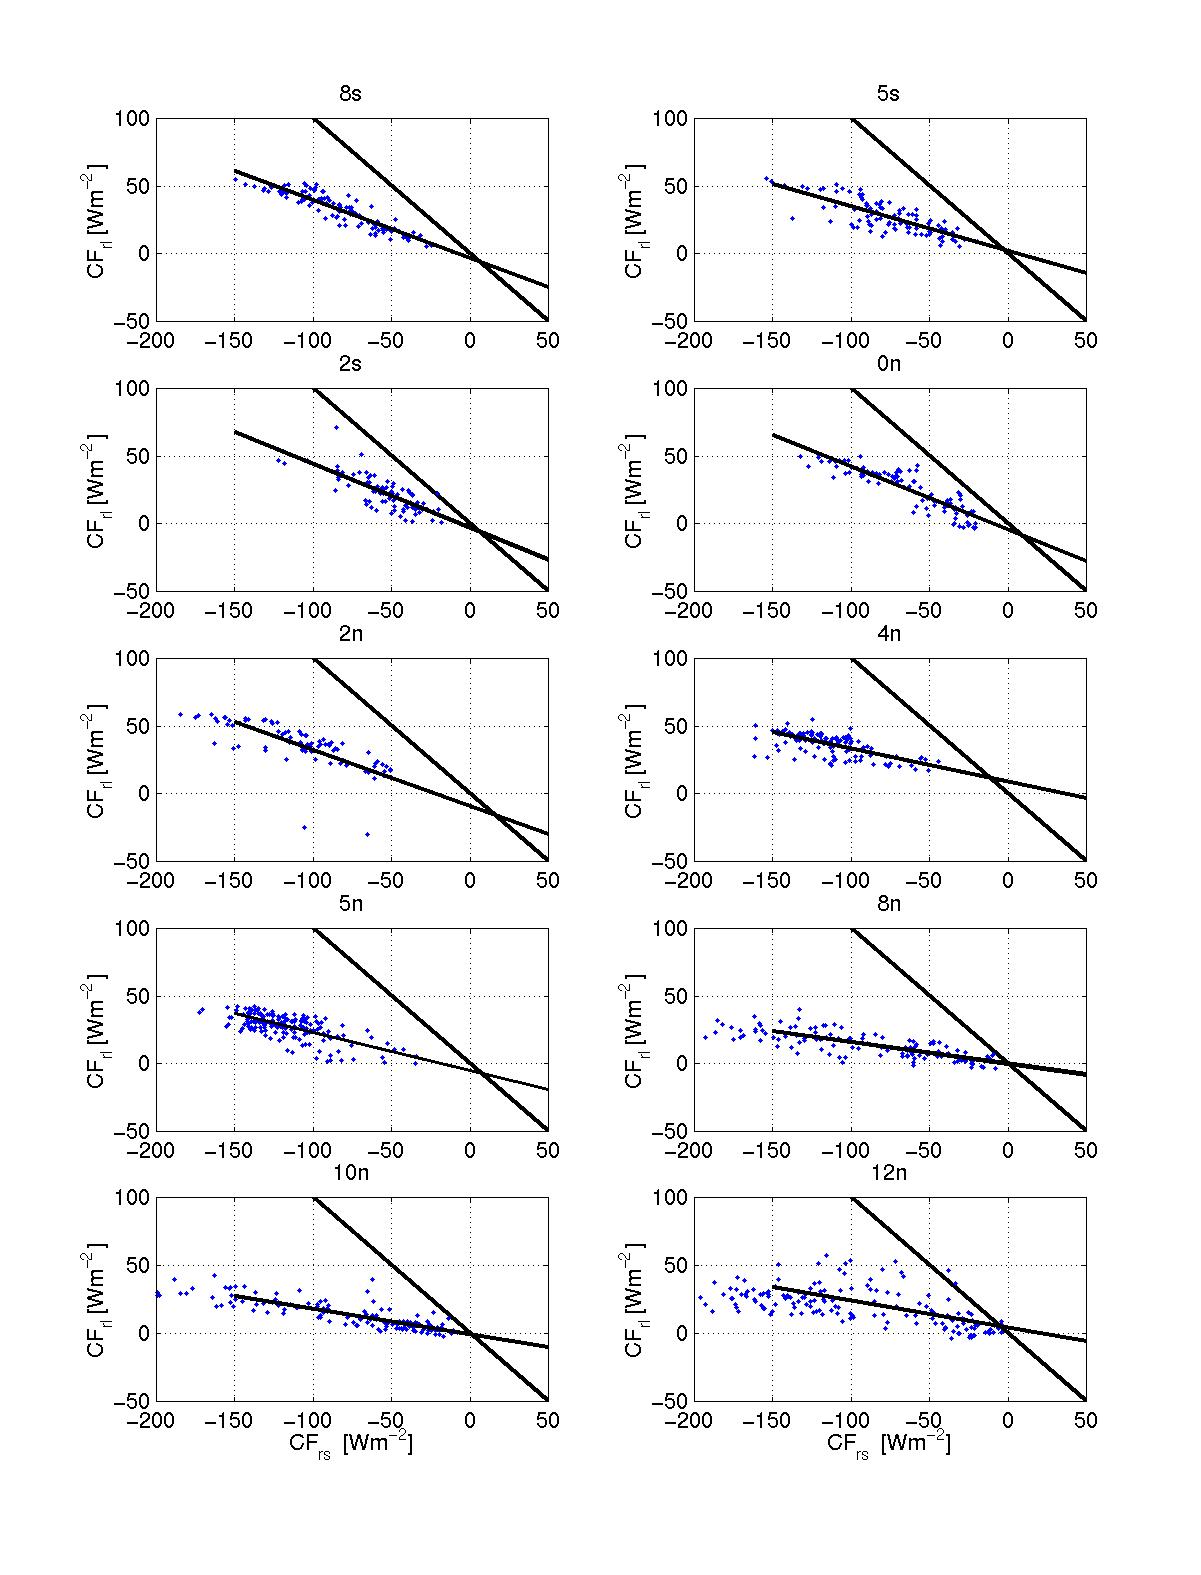
In the next 2 slides we see the scatter plot of
solar cloud forcing (x-axis) vs. longwave cloud forcing (y-axis)
for each site, using daily data (left) and 15-day smoothed data
(right).
Ignore the daily-averaged (left) plot below. There is alot of
scatter caused by the diurnal cycle. Solar cloud forcing is
just a 12-hour feature, whereas ir cloud forcing is a 24-hour
feature (both are 24-hour averaged).