Hi,
The heart of this question was making a custom color-line key for time series plots. Overlaying on a plot with a time axis has always been hard to do. It will be improved with the next Ferret release, but for this particular situation, just drawing a key, we don't really need to do a time overlay.
Instead, define a separate viewport, and then it's a matter of drawing simple line plots and labels inside.
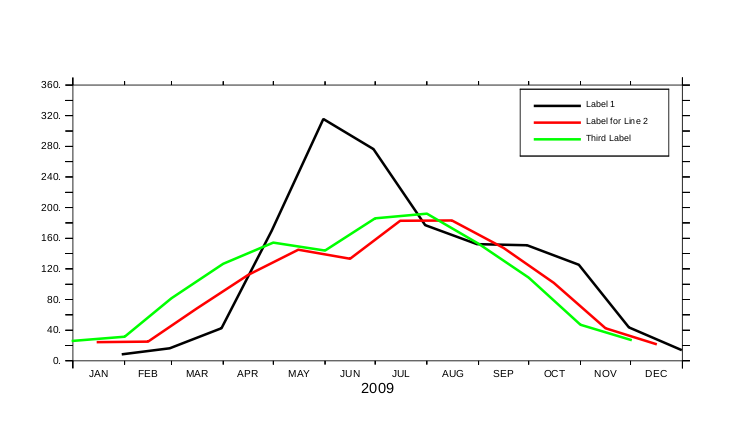
yes? ... open datasets, define variables to plot together! Plot the variables together, using a viewport.yes? set view full yes? plot/nolab/thick/color=black/vlimits=0:360 var1 yes? plot/over/nolab/thick/color=red var2 yes? plot/over/nolab/thick/color=green var3! There is space in the upper right, so define a viewport that lies inside the plot axes. ! It can be adjusted to make it a good size and shape for the lines and labels. ! Note use of the /AXES qualifieryes? define viewport/axes/xlim=0.7:0.9/ylim=0.65:0.8 vkey yes? set view vkey! Turn off axis tics and labels. These commands persist to subsequent plot calls. ! Make a plot with limits of 0:1 in both directions, with nothing drawn but the plot axesyes? ppl axlabp,0,0 yes? ppl tics,0,0,0,0 yes? plot/vs/nolab/vlim=0:1/hlim=0:1 {2,2}, {2,3}! Now draw lines and labels for the plot key. The locations are relative to ! this viewport only, so they are in the nice simple range 0:1 throughout.yes? plot/over/vs/line=13/nolab {0.1,0.4}, {0.75,0.75} yes? label 0.44,0.73,-1,0,0.15,Label 1yes? plot/over/vs/line=14/nolab {0.1,0.4}, {0.5,0.5} yes? label 0.44,0.48,-1,0,0.15,Label for Line 2yes? plot/over/vs/line=15/nolab {0.1,0.4}, {0.25,0.25}
yes? label 0.44,0.23,-1,0,0.15,Third Label
On 6/28/2016 7:42 AM, afwande juliet
wrote:
Dear FerretersI want to plot annual cycles like the ones below. These ones are examples are copied from some online sources. I am using this script attached but only getting empty space figure also attached. I have used this http://www.precisrcm.com/GRACE/KL_worksheets/worksheet_KL_2a.html to calculate annual cycel before plotting in ferret but gets empty space. Could someone show me how to go about this. The data am using is monthly data in kg/m2/s2