hi,
- The behavior where only one of the color overlay lines for the
plot key is drawn, is fixed in our next release, to be announced
within the next few days.
- In the lines of the script I sent, I neglected to define the
variable TT; so that is the cause of the error message. It needs,
LET tt = T[GT=pr1] ! tt is the coordinates along the T axis
The labeling along the time axis are automated and there is not a
control that would let you label the month names but not the year.
You could add "months", using another "annotate" command and
lining up the label next to the 2009. Sometimes for a final
publication plot, just putting the image into an image editing
program to change a few details such as this is another answer.
-Ansley
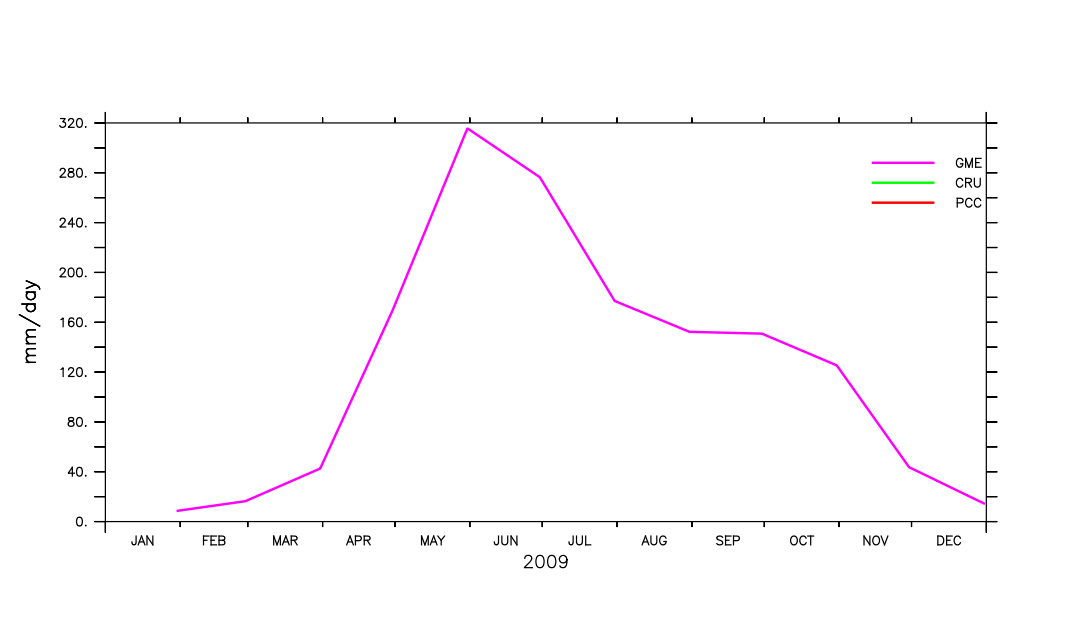
How Do I set these so that plotting is labbelledI get this complains **ERROR: variable unknown or not in data set: TT[T="31-DEC-2009"@ITP]pr3 GPCC begins at 01 Jan 2009-01 Dec 2009pr2 CRU begins at 16 Jan 2009 -16 Dec 2009My pr1 GME data begins at 31 Jan-31-Dec 2009All the pr1,pr2 and pr3 are plotted well but there is no label, no legend on vertical axis and horizontal axis read 2009 but I want it to read MonthsHowever when Do likeplots only one lineHi Thanks Ansley and AllI tried to plot my three data using instructions in script above. But these
plot/nolabel/color=purple/thick pr1
plot/nolabel/color=green/thick pr2
plot/nolabel/color=red/thick pr3
plot/nolabel/color=purple/thick pr1
plot/nolabel/over/color=green/thick pr2
plot/nolabel/over/color=red/thick pr3
plot/over/vs/nolabel/line/color=purple/thick {`t0`,`t1`},{`y1`,`y1`}
Command file, command group, or REPEAT execution aborted
LET t0 = tt[T="31-DEC-2009"@itp]
LET t1 = tt[T="16-DEC-2009"@itp]
LET t2 = tt[T="01-DEC-2009"@itp]
i have done a screen shot of the plot that appears and my data just incase something is wrong with how I am defining the grids
On Thu, Jun 30, 2016 at 10:59 PM, Ansley C. Manke <ansley.b.manke@xxxxxxxx> wrote:
Hi,
Our upcoming Ferret release will make the labeling and drawing overlays on Time plots work much better. It's always been necessary to do lots of work to overlay on a time-axis plot, but this is much improved with the Ferret v7. Drawing the color-key lines does not work correctly prior to Ferret v7.
The "ANNOTATE" command, which is in the current Ferret release, v696, also makes adding labels to the plot much easier.
...
yes? plot/nolabel/color=purple/thick pr1
yes? plot/nolabel/color=green/thick pr2 ! (lines 2 and 3 not drawn above)
yes? plot/nolabel/color=red/thick pr3
! Set up time locations for locating key and labels
yes? LET t0 = tt[T="10-DEC-2009"@itp]
yes? LET t1 = tt[T="15-NOV-2009"@itp]
yes? LET t2 = tt[T="15-NOV-2009"@itp]
! Set Y locations for key lines, as a fraction the range of the Y axis that was plotted.
yes? let y1 = (($yaxis_max) - ($yaxis_min))*0.9
!-> DEFINE VARIABLE y1 = (320.0000 - 0.000000)*0.9
yes? let y2 = (($yaxis_max) - ($yaxis_min))*0.85
!-> DEFINE VARIABLE y2 = (320.0000 - 0.000000)*0.85
yes? let y3 = (($yaxis_max) - ($yaxis_min))*0.8
!-> DEFINE VARIABLE y3 = (320.0000 - 0.000000)*0.8
! Draw legend lines. The coordinates are in the same units as the line plot.
yes? plot/over/vs/nolabel/line/color=purple/thick {`t0`,`t1`},{`y1`,`y1`}
!-> plot/over/vs/nolabel/line/color=purple/thick {262464,261864},{288,288}
yes? plot/over/vs/nolabel/line/color=green/thick {`t0`,`t1`},{`y2`,`y2`}
!-> plot/over/vs/nolabel/line/color=green/thick {262464,261864},{272,272}
yes? plot/over/vs/nolabel/line/color=red/thick {`t0`,`t1`},{`y3`,`y3`}
!-> plot/over/vs/nolabel/line/color=red/thick {262464,261864},{256,256}
! Now use "ANNOTATE/NORM" to add labels. /NORM locates the labels relative to
! the box made by the plot axes.
yes? annotate/norm/xpos=0.995/ypos=0.8/halign=1/valign=0/siz=0.1 @ASPCC
yes? annotate/norm/xpos=0.995/ypos=0.85/halign=1/valign=0/siz=0.1 @ASCRU
yes? annotate/norm/xpos=0.995/ypos=0.9/halign=1/valign=0/siz=0.1 @ASGME
! Add a y-axis label
yes? annotate/norm/xpos=-0.08/ypos=0.5/halign=0/siz=0.15/angle=90 "@ASmm/day"
On 6/30/2016 11:56 AM, Ansley C. Manke wrote:
Hi,
The ERROR is because there needs to be a space between the 15 and the _expression_ in { }.
For your LABEL commands, are you drawing the key with colored lines? You may be able to use one of the 'legend' or 'legline' scripts.
yes? go /help legend
Full path name: /home/users/tmap/ferret/x86_64-linux/contrib/legend.jnl
\cancel mode verify
! Contributed by Hein Zelle, 11-December-2003
! Run test_legend.jnl for an example which calls this script.
...
! go legend line# title [location]
!
! where location is one of ul, ur, ll or lr
! default location is ul
So the script will draw a legend line in one corner of your viewport. Run the script "go test_legend" which demonstrates it.
There is also an FAQ which shows an example, http://ferret.pmel.noaa.gov/Ferret/faq/working-with-the-legend-on-a-line-plot
On 6/30/2016 8:05 AM, afwande juliet wrote:
I have also attached sample data for your helpAttached is my scriptthis how it complainsThanks for this helpwhen I plot the data it is plotted but I cant be labelled
lot /over/vs/nolabel/line=12 {`t0`,`t1`},{2.35,2.35}; label `t2`, 2.35,-1,0,0.14 @AS GME
!-> plot /over/vs/nolabel/line=12 {262968,262608},{2.35,2.35}
!-> PPL %LABEL 100000, 2.35,-1,0,0.14 @AS GME
plot /over/vs/nolabel/line=15{`t0`,`t1`},{2.05,2.05}; label `t2`, 2.05,-1,0,0.14 @AS CRU
!-> plot /over/vs/nolabel/line=15{262968,262608},{2.05,2.05}
**ERROR: invalid command: no data specified
plot /over/vs/nolabel/line=15{262968,262608},{2.05,2.05}
Command file, command group, or REPEAT execution aborted
On Tue, Jun 28, 2016 at 7:49 PM, Ansley C. Manke <ansley.b.manke@xxxxxxxx> wrote:
Hi,
Computation of an annual cycle is done in Ferret with "modulo regridding" operations, and our terminology for this is "climatologies". Here is an FAQ about that,
http://ferret.pmel.noaa.gov/Ferret/faq/how-do-i-calculate-climatologies-and-climatological-anomalies
As a general suggestion, when writing a script, it's a good idea to plot things separately, and with default settings, before putting everything together for your final script. For instance, your script has these lines:
plot/vlimits=-2.5:2.5:0.5/nolabel/line=8 pr1[d=1]*30but those commands are returning a blank plot. so, try the plot commands separately,
plot/level=(0,600,30)(inf)/vlimits=-2.5:2.5:0.5/over/nolabel/line=14 pr2[gt=pr1@asn]*30
plot/level=(0,600,30)(inf)/vlimits=-2.5:2.5:0.5/over/nolabel/line=15 pr3[gt=pr1@asn]*30
plot pr1[d=1]*30; pauseNow you may start to see what is happening with the definition of the variables and the plot commands. Once you have the definitions right, then put them together with overlaying and different colors, and work with labeling etc to get the final plot.
plot pr2[gt=pr1@asn]*30; pause
plot pr3[gt=pr1@asn]*30; pause
(By the way, the /LEVEL qualifier is for setting color levels on a color fill plot. It can be used on a 1-D "plot" command, but only when you are coloring the line according to some second quantity. See RIBBON plots, http://ferret.pmel.noaa.gov/Ferret/documentation/users-guide/commands-reference/PLOT#_PLOT_RIBBON)
Ansley
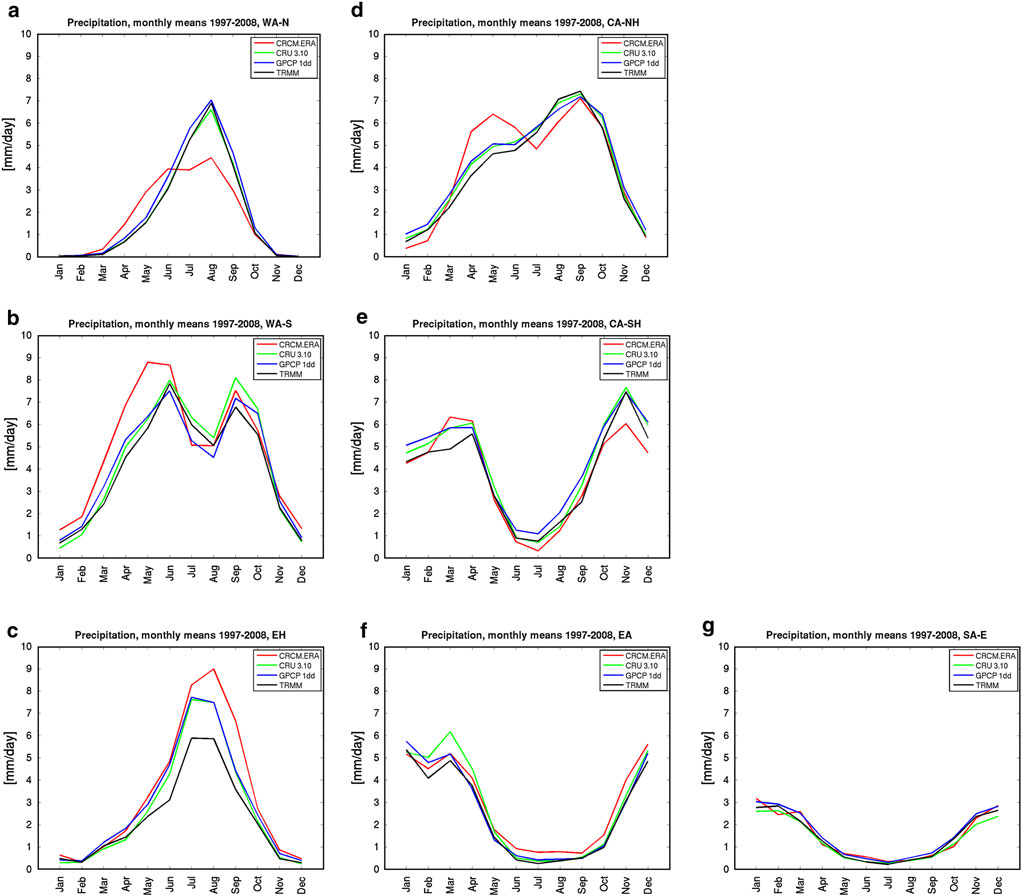
On 6/28/2016 7:42 AM, afwande juliet wrote:
Dear FerretersI want to plot annual cycles like the ones below. These ones are examples are copied from some online sources. I am using this script attached but only getting empty space figure also attached. I have used this http://www.precisrcm.com/GRACE/KL_worksheets/worksheet_KL_2a.html to calculate annual cycel before plotting in ferret but gets empty space. Could someone show me how to go about this. The data am using is monthly data in kg/m2/s2