Dear All,
Just a quick report back:
To turn the plot around Ansley’s and Martin Schmidt’s suggestions worked.
Following Ansley:
shade/vlim=90:-90 st[i=1:43200:60,j=1:21600:30]
turns the plot around nicely.
Martin had suggested to write to a netcdf file first and then use the order qualifier when reading the data in netcdf back in.
Like so:
save/file=hwsd.nc st
use/order=x-y hwsd.nc
The latter has the advantage that when I now select points based on lat and lon with samplexy, these are correct sections.
Also, Ansley was right saying that I had a precision issue (even though I thought that I had put in enough 3s)
Using the following axis definitions gives me the expected number of points (see below).
Maybe that’s of use to somebody,
Cheers,
Joerg
define axis/x=-180:180:`1/120`/edges/modulo/unit=degrees x1km
define axis/y=-90:90:`1/120`/edges/unit=degrees y1km
define grid/x=x1km/y=y1km gr1km
set data/ez/format=stream/var=st/type=i2/grid=gr1km hwsd.bil
show data
currently SET data sets:
1> ./hwsd.bil (default)
name title I J K L M N
ST ST 1:43200 1:21600 ...
From: Ansley Manke [mailto:ansley.b.manke@xxxxxxxx]
Sent: 19 November 2013 18:56
To: Kaduk, Joerg (Dr.); ferret_users@xxxxxxxx
Subject: Re: [ferret_users] Doubt on usage of SCAT2GRID_BIN_XYT function
Hi Joerg,
Try this to flip the plot over in Y:
SHADE/VLIMITS=90:0
The axis definition will always have increasing coordinates, but in the graphics step, we can ask the plot to be drawn the other way up.
Yes, I think the question about the axis definition is due to rounding. Axis coordinate definitions are made in double precision, so 0.00833333 is smaller than 1/120 when stored in double precision. To define the axis without issues of precision, you could use /NPOINTS:
define axis/x=-180:180/npoints=43200/edges/unit=degrees x1km
Or, give the full double-precision value for 1/120
define axis/x=-180:180:0.008333333333333333/edges/unit=degrees x1km
Either of these gives you the correct modulo axis, with the grid cell edges at -180 and 180 and the grid cell centers half of a 1/120 degree grid cell size from each end. Writing delta-x without its full precision may result in the wrong number of cells, and if the total length becomes longer than 360 then it isn't a modulo axis.
Ansley
On 11/19/2013 2:52 AM, Kaduk, Joerg (Dr.) wrote:
Hello,
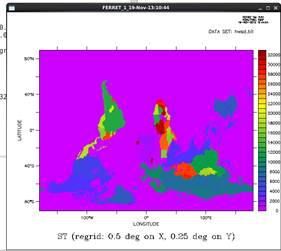
I am reading some binary stream data and I get them displayed upside down (see below).
I tried various things to turn the data around, but haven’t found the trick.
Any pointer most appreciated.
Another thing I found strange was that if I used the axes with /edges I got one point too many:
define axis/x=-180:180:0.00833333/edges/unit=degrees x1km
gave me 43201 points. A rounding issue?
This is:
FERRET v6.84
Linux 2.6.32-358.11.1.el6.x86_64 64-bit - 09/05/13
Thank you very much!
Cheers,
Joerg
canc data 1
define axis/x=-179.99583333:179.99583333:0.00833333/unit=degrees x1km
define axis/y=89.99583333S:89.99583333N:0.00833333/unit=degrees y1km
define grid/x=x1km/y=y1km gr1km
set data/ez/format=stream/var=st/type=i2/grid=gr1km hwsd.bil
show data
set mem/size=4000
shade st[i=1:43200:60,j=1:21600:30]
I can reverse the y axis like so:
define axis/y=89.99583333N:89.99583333S:0.00833333/unit=degrees y1km
but that does not make a difference
