Hi Peter,
You're right that you could do this kind of thing with a scat2grid function. The projection doesn't change in time, so write the longitudes and latitudes, say as lists of xpts, ypts. Then list the data variable as a 2D variable, location vs time. These might be in 2 files, one for the longitude,latitude data and a second for the data field. Read these in using Ferret ascii commands and then do the scat2grid function to combine them into a gridded variable
DEFINE AXIS/x=12.44:25.22/np=97 long
DEFINE AXIS/y=44.64:50.01/np=61 lati
DEFINE AXIS/t=1:124:1 time
DEFINE GRIDx=long/y=lati gridxy
DEFINE GRID/t=time/x=long/y=lati gridxyt
SET DATA/EZ/VARIABLES="lon,lat"/GRID=gridxy "myfile_lon_lat.txt"
SET DATA/EZ/VARIABLES="tmp"/GRID=gridxyt "myfiletmp.txt"
LET gridded_var = scat2gridlaplac_xy(lon[d=1],lat[d=1],tmp[d=2],...
But maybe you can leave things in the lambert projection.
Is your main goal to do graphics in Ferret? If so, then what you want to have in your file is 2-D fields for the LONGITUDE and LATITUDE variables, and then the data field a function of i,j, and time. This is then Curvilinear data in netCDF and Ferret terminology, and Ferret can do graphics directly with it.
The netCDF file you'd be aiming for would look something like this
name title I J K L
VAR DATA 1:97 1:61 ... 1:124
LON LONGITUDE 1:97 1:61 ... ...
LAT LATITUDE 1:97 1:61 ... ...
Where I've just made up the numbers i=1:200 and J=1:00. The underlying xy grid is just indices, and the longitude and latitude variables describe locations on the Lambert projection. If you can think of a way to output the data in this arrangement, then you're set. It might be that you'd put the data out in 3 files, one for longitudes, one for latitudes, and a third for the data field, including its time steps, and then read them in as ascii or whatever kind of files they need to be, then read them in using Ferret and write a single netCDF file.
Ansley
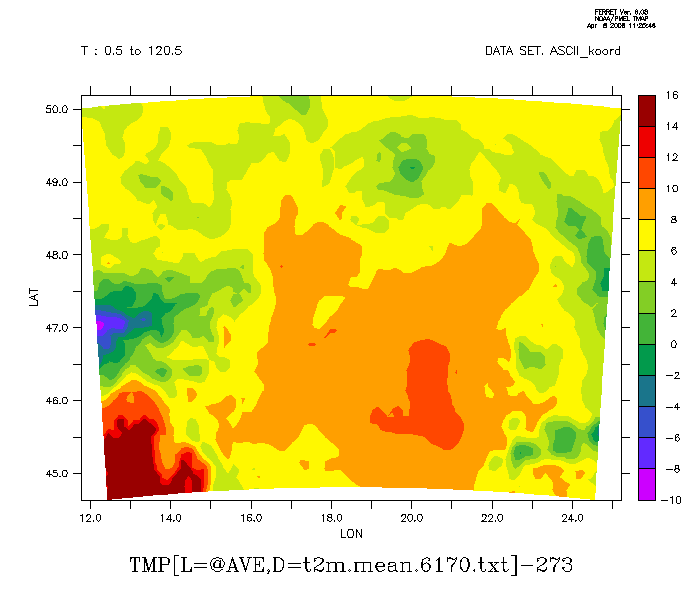
Attachment:
lambert.gif
Description: GIF image
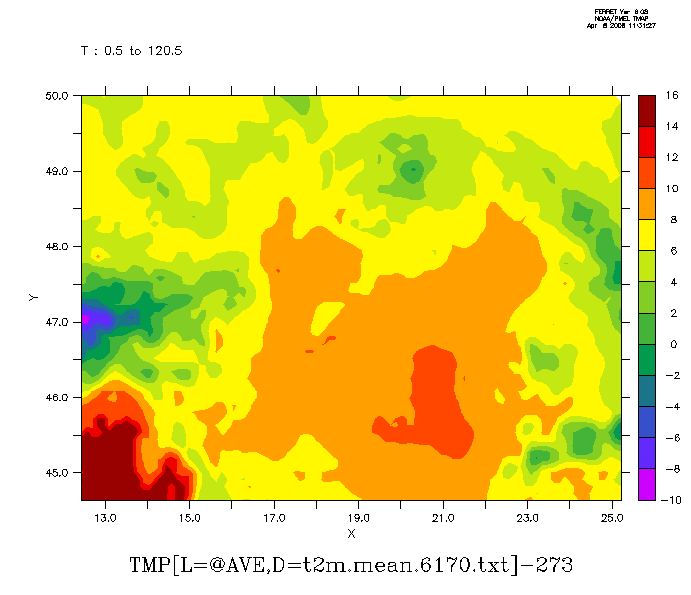
Attachment:
scattered.gif
Description: GIF image
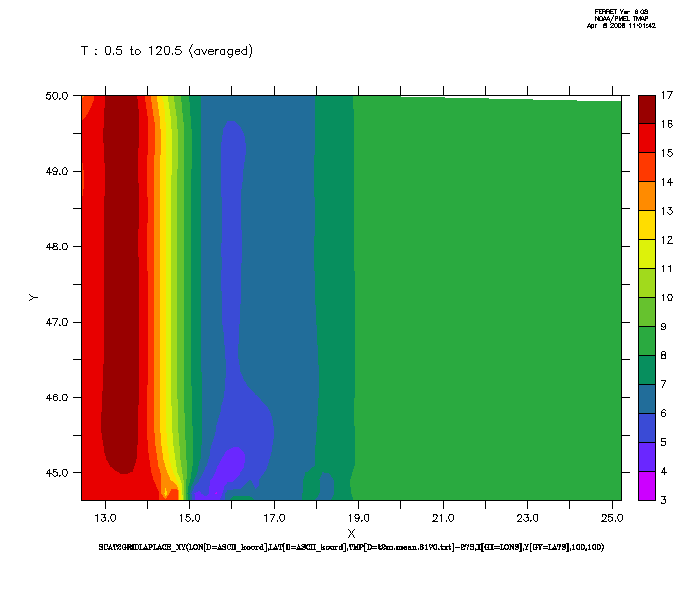
Attachment:
laplace_grid.gif
Description: GIF image
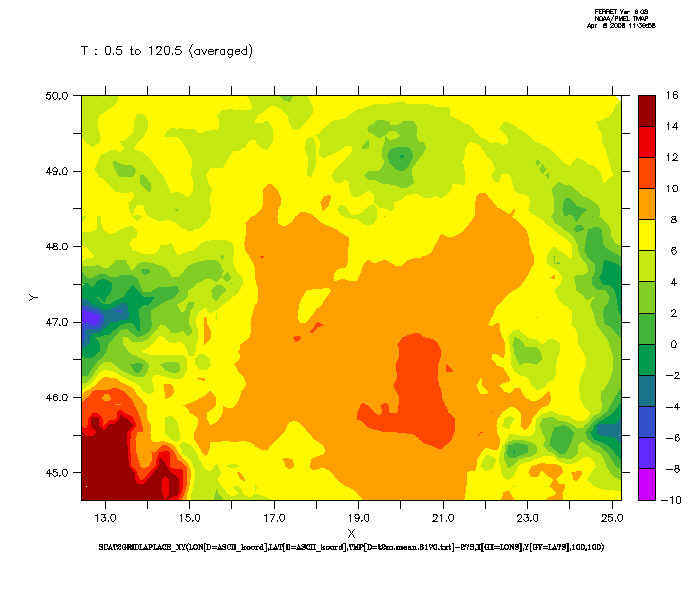
Attachment:
laplace_nogrid.gif
Description: GIF image