[Thread Prev][Thread Next][Index]
Re: contours and boundary between colors
Hi there,

I wrote:

>I'm wondering if it is possible to ensure that the boundary
>between color shadings coincide with overlaid contours
>plotted for the same field: [...]

to which Ansley replied:

| Either a URL or a gif  attachment is ok.  I'd like to see an
| example. The FILL and CONTOUR commands use the same interpolation
| algorithm, but the graphics calls using the computed boundaries
| between contour levels are of course different, and so the
| difference may be there.

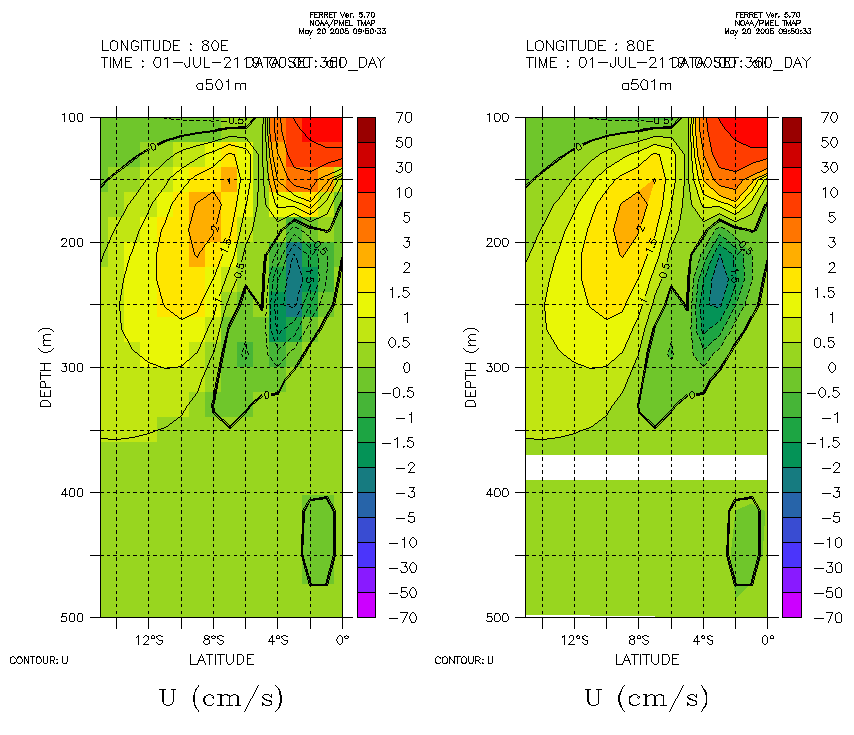
Thanks for the response!  The left panel of the attached plot shows
SHADE and CONTOUR, to give you an idea of how the real data is
distributed, and the right panel shows FILL and CONTOUR.  The 2 cm/s
contour at 8S and 190m depth doesn't exactly coincide with the
boundary between the orange and light orange.  The zero contour near
the lower right corner doesn't coincide with the color boundary,
either.

Here's the script that produced the plot:
>>>>>>>>>>>>>>>>>>>>>>
set data "a501m-cont/all.nc"

define symbol lev lev=(-2,2,0.5)(-3,3,1,-1)(-5,5,2,-1)(-10,10,5,-1)(-70,70,20,-1)
define symbol attr x=80/hlimits=15s:0/vlimits=100:500/l=60/($lev)

set view left
shade/($attr)       u
contour/($attr)/ov  u

set view right
fill/($attr)        u
contour/($attr)/ov  u
<<<<<<<<<<<<<<<<<<<<<<<

Regards,
Ryo

[Thread Prev][Thread Next][Index]
Dept of Commerce /
NOAA /
OAR /
PMEL /
TMAP
Contact Us | Privacy Policy | Disclaimer | Accessibility Statement
