[Thread Prev][Thread Next][Index]
Crossed Axes - Answer
Hello,
Thanks to Mick Spillane who provided the answer for the crossed-axes
question that I posed last week.
The solution was to use the following PPL commands:
plot /set correlation_var
ppl axset,0,0,0,0 ! Removes the four axes
ppl yaxis, `ymin`, `ymax`, `ytic_interval` ! setup y-axis
ppl plot
This plots your data with no axes whatsoever. I then manufactured the axes
using:
ppl %xaxis, `xmin`, `xmax`, `xtic_interval`,,.....,0
ppl %yaxis similarly
The % sign forces ferret to plot these axes immediately. Options for these
can be found in the PPL user guide.
Finally I put on my own labels using the 'label' command in a repeat loop.
Note you need to do this in two seperate halfs if you don't want your
labels near the origin to be placed on top of the axis.
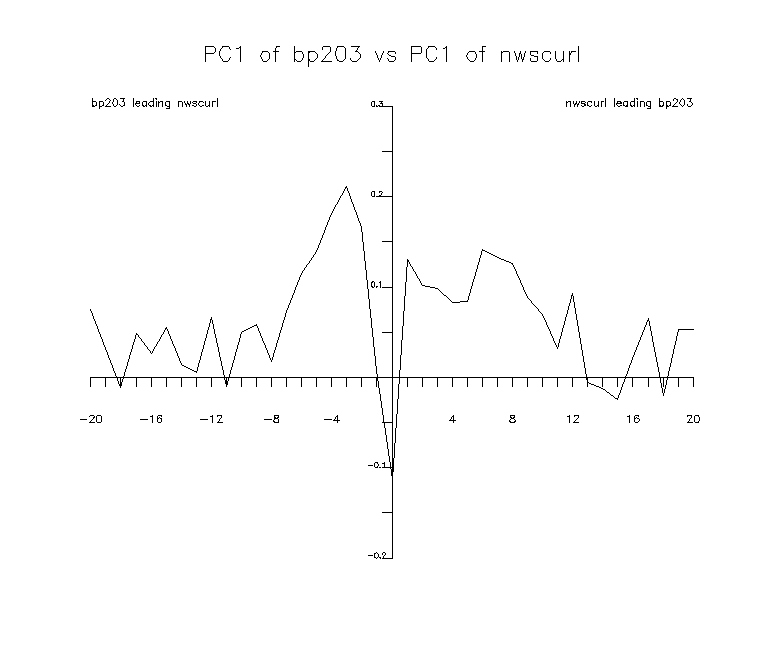
An example of the results for those interested in included as an
attachment (GIF format).
Thanks once again to Mick,
Graham Gladman
[Thread Prev][Thread Next][Index]
Dept of Commerce /
NOAA /
OAR /
PMEL /
TMAP
Contact Us | Privacy Policy | Disclaimer | Accessibility Statement