Field Work
Repeat Hydrography
A subset of the planned CLIVAR Repeat Hydrography Program sections is shown above (click for to see large image). The US component of this international program is supported jointly by NSF and NOAA. The goal of this program is to repeat key full-depth hydrographic sections in the global ocean at intervals of ~10 years in order to detect decadal-scale changes in ocean circulation, chemistry, physics and biology. Recent measurements by the NOAA-PMEL Ocean Tracer group were made along:
- A16 in 2013 and 2003 (left column, above)
- A10 in 2011 (left column, above)
- A13.5 in 2010
- I05 in 2009
- P18 in 2008
- I8S/I9S in 2007
- P16N in 2006
CFC-12 concentrations (pmol kg-1) along meridional sections A16 in the Atlantic Ocean in 2013 and zonal section A10 along ~30oS in the Atlantic Ocean in 2011 are shown above, left.
CFC concentrations are highest in surface waters, and there is a strong signal in the mode and intermediate waters, reflecting vigorous ventilation of these waters on decadal timescales.
There is a strong signal in the deep North Atlantic, from rapid ventilation of North Atlantic Deep and Labrador Sea Waters. There is a clear CFC signal in the abyssal waters along the southern ends of A16 and along most of the A10 section, reflecting ventilation via Antarctic-derived bottom waters from the south. The extremely sensitive analytical techniques for measuring dissolved CFCs allows the ventilation pathways to be detected in regions where the corresponding anthropogenic CO2 signal is difficult to detect directly.
Field work at Hawaii Ocean Time-Series (HOT) site
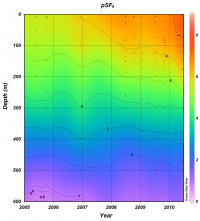
Recent efforts (supported by NOAA’s Climate Program Office) at the Hawaii Ocean Time-Series (HOT) site have allowed development of techniques for simultaneously measuring dissolved SF6 along with CFCs in the same water sample. These techniques are now being used routinely as part of the CLIVAR/GO-SHIP Repeat Hydrography Program. The figure above right shows SF6 time-series measurements made at the HOT site during the 6 year period between 2005 and 2010 (click image to see full size figure).
There can be significant advantages in using multiple transient tracers to better estimate transit time distributions (TTDs), ideal ages and anthropogenic CO2 uptake.


